
Probability
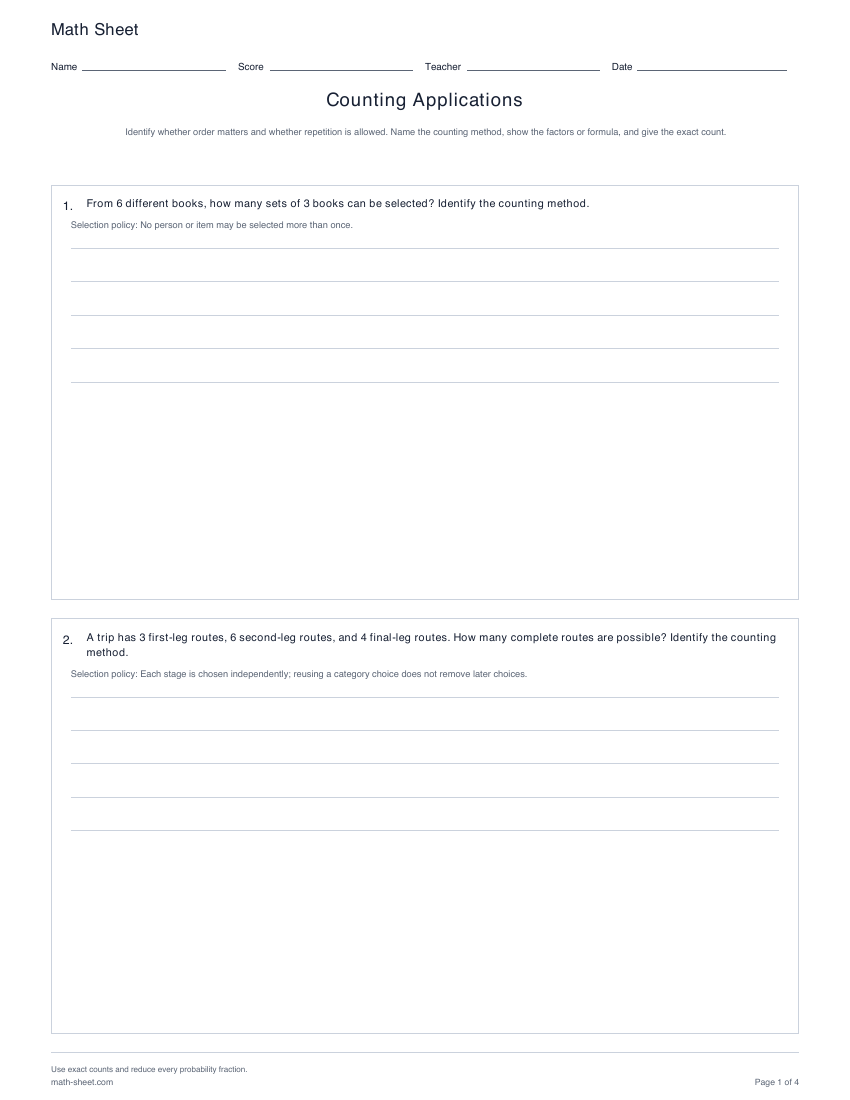
Counting Applications worksheets
Choose among the multiplication principle, ordered selections without replacement, and unordered combinations in varied finite contexts.
Preview and downloadModel chance. Reason from data.
Prepare a sequence of original worksheets that connects probability models to conclusions from data. Choose individual skills or assemble an editable packet for a lesson, tutorial or review.
44 printable resources with separate worked answer pages.
Choose a topicUse algebra, functions, sums, derivatives and basic definite integrals. Review sample variance and z-scores before inference. Teachers can select calculator-supported tasks or supplied numerical references as each worksheet allows.
Review sample variance · Review z-scores · Review sets and Venn diagrams · Review calculus
Step 1
Choose a sample space, reconstruct overlapping counts and keep the direction of every conditional probability clear.
Probability
Choose among the multiplication principle, ordered selections without replacement, and unordered combinations in varied finite contexts.
Preview and download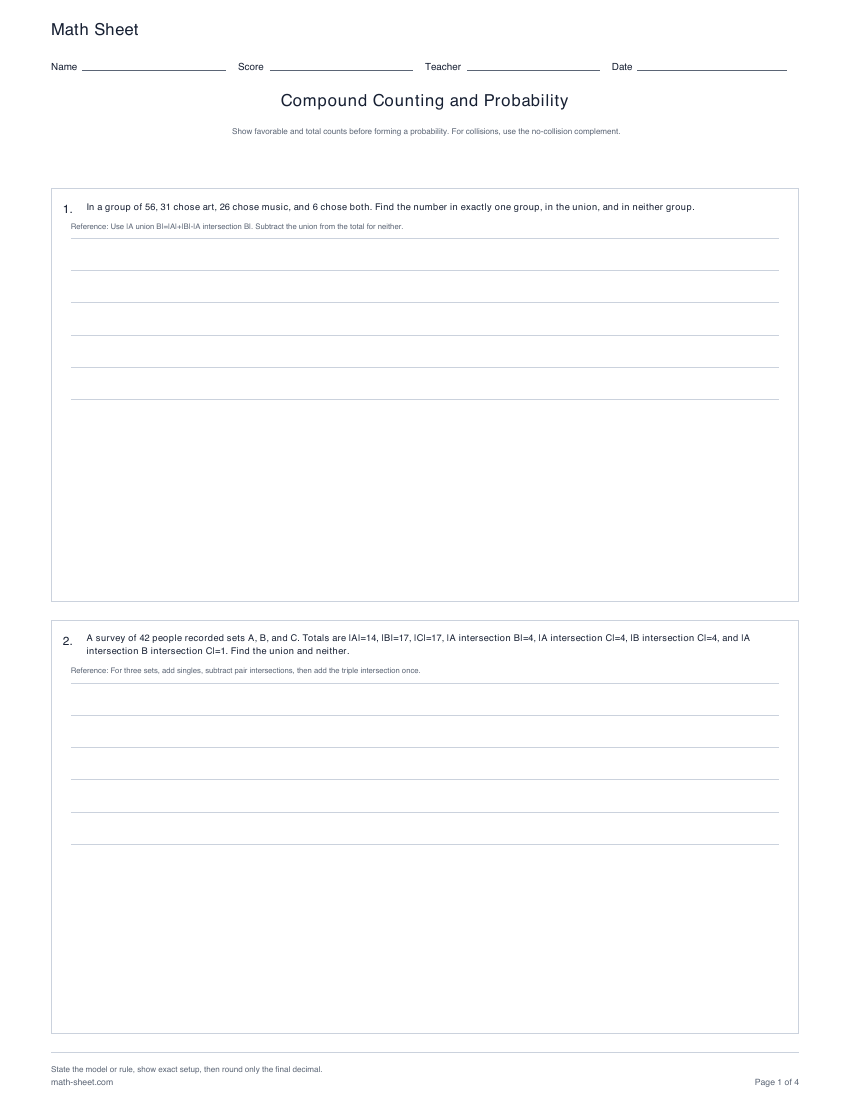
Probability
Reconstruct two- and three-set totals, count compound outcomes, and calculate collision probabilities by complements.
Preview and download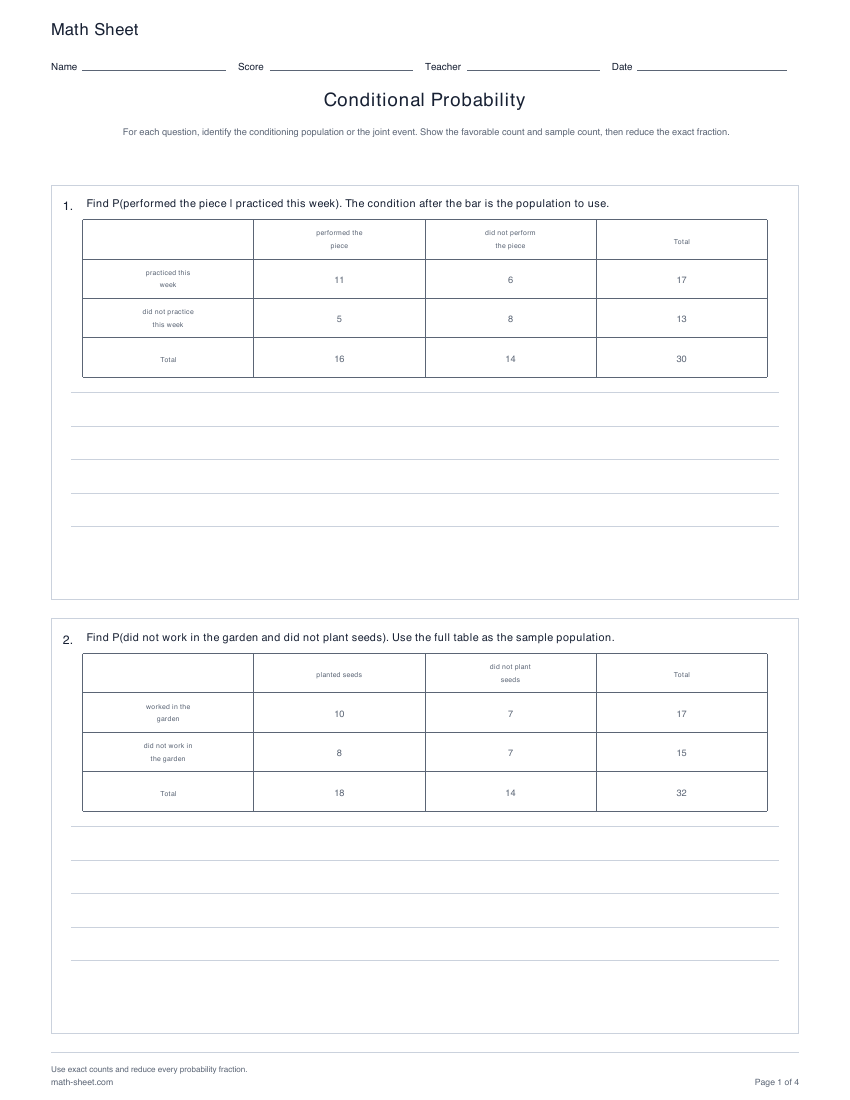
Probability
Compare conditional and joint probabilities using complete two-way count tables and two sequential draws without replacement.
Preview and download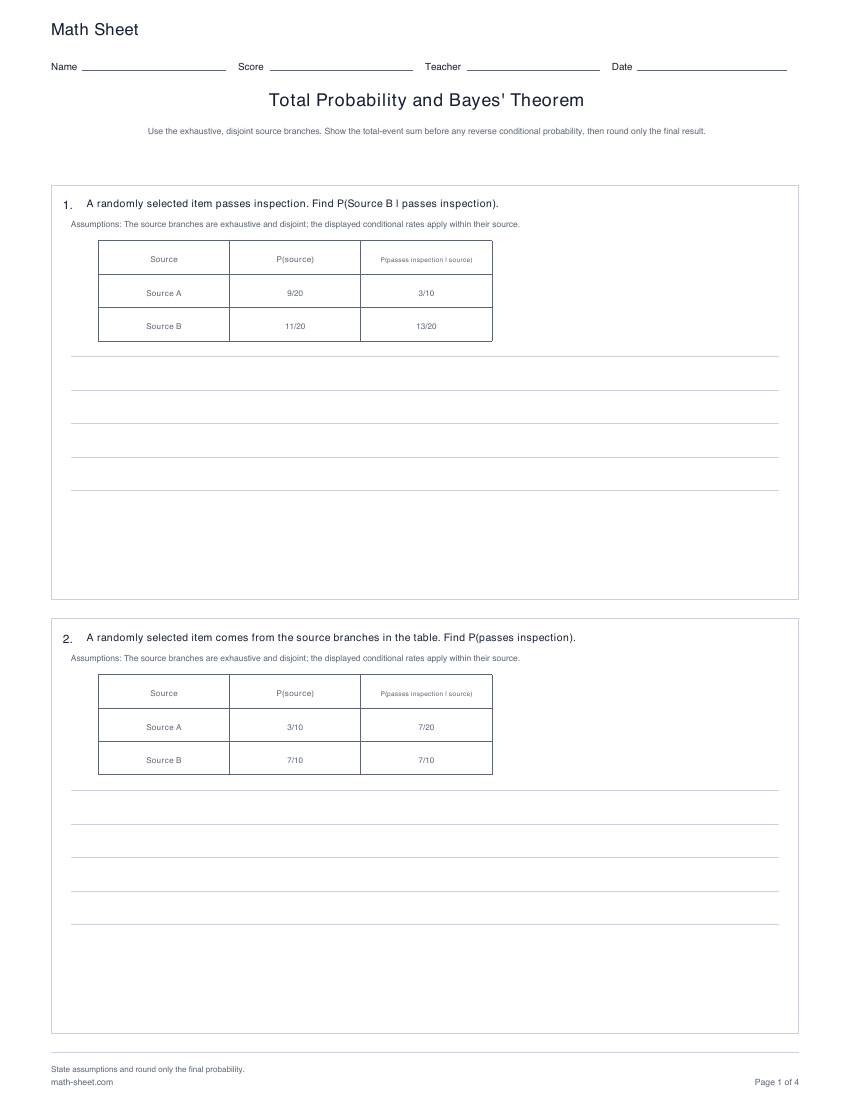
Probability
Practice forward total probability and reverse conditional probability with explicit two- and three-source partitions.
Preview and download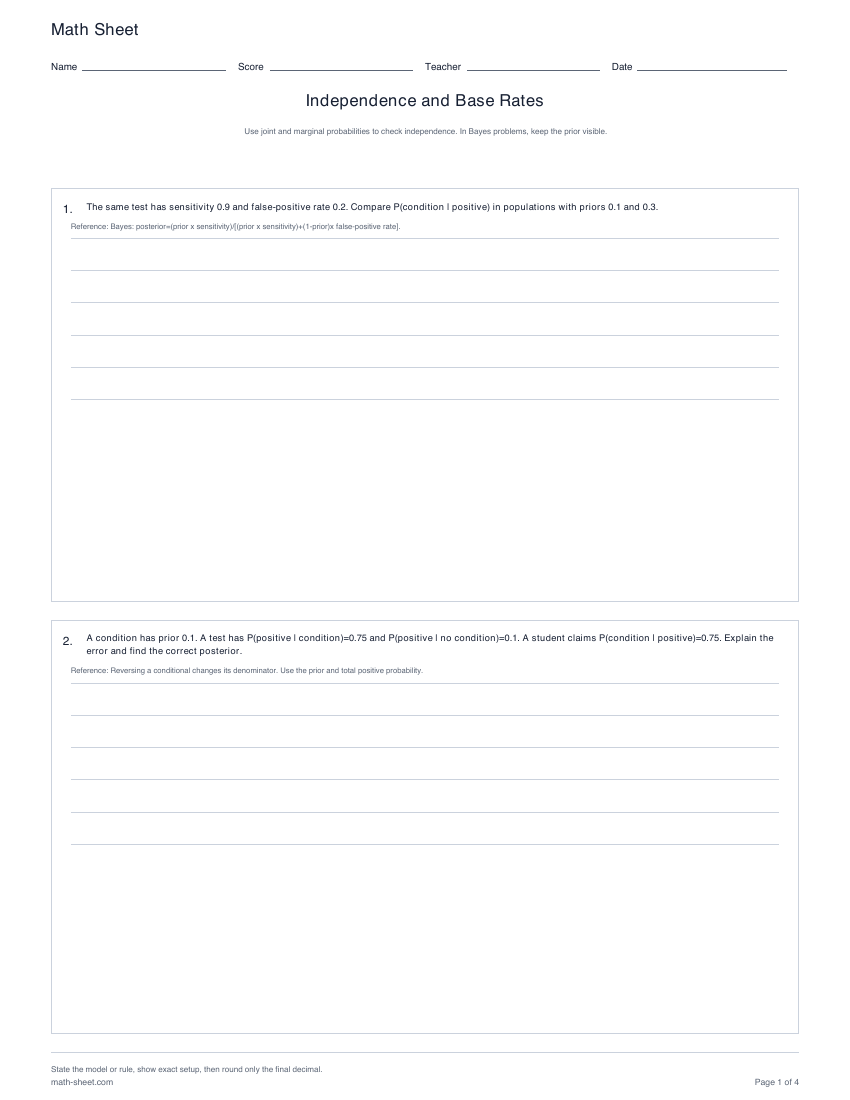
Probability
Check independence in rational tables and compare Bayesian posteriors under different priors.
Preview and downloadStep 2
Move from a PMF to its CDF, quantiles and moments. Choose a model from the experiment and state its assumptions.
Probability
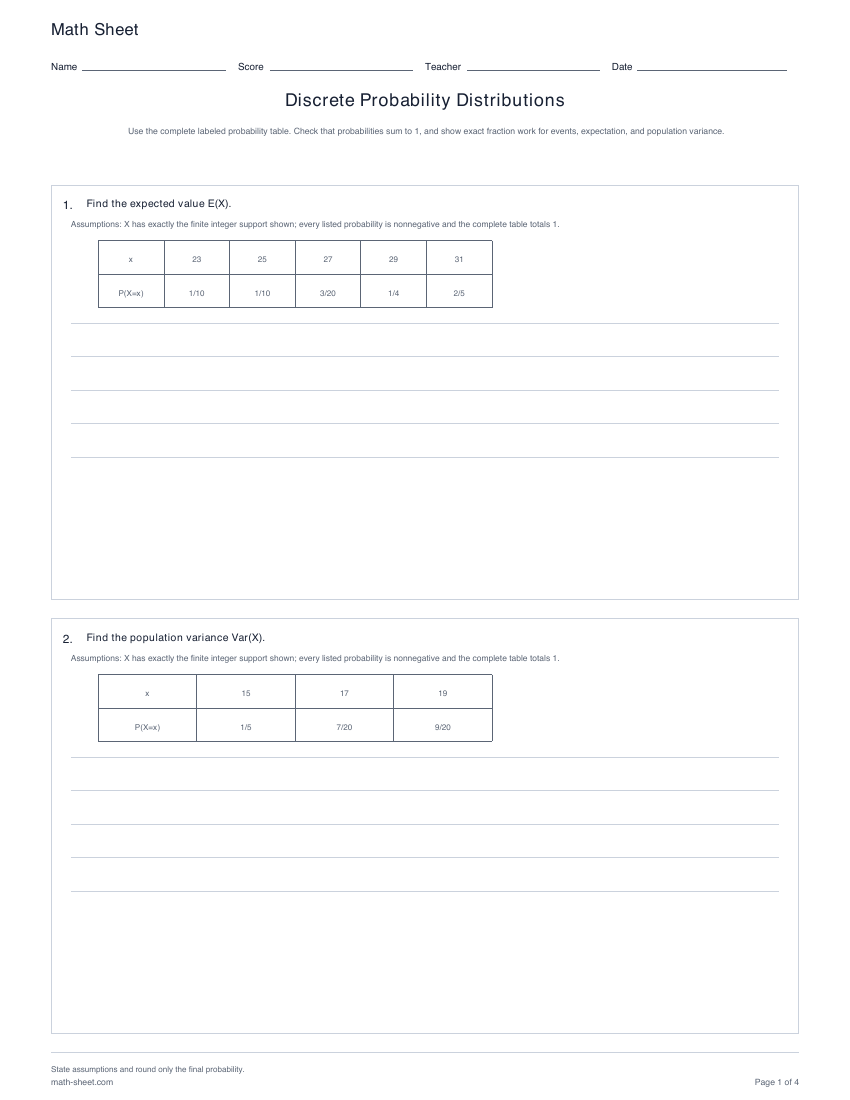
Use valid finite probability tables to find missing entries, event probabilities, expected value, and population variance.
Preview and download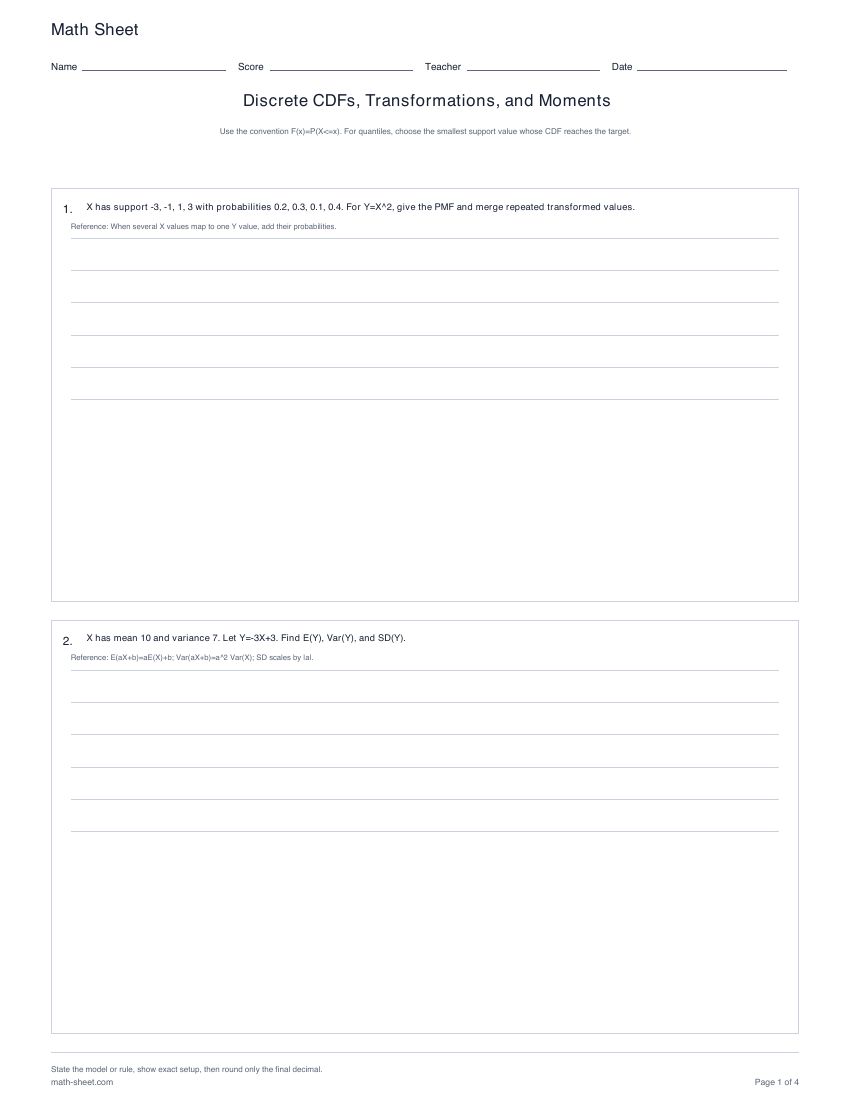
Probability
Build step CDFs, find quantiles, merge transformed PMFs, and apply weighted moment rules.
Preview and download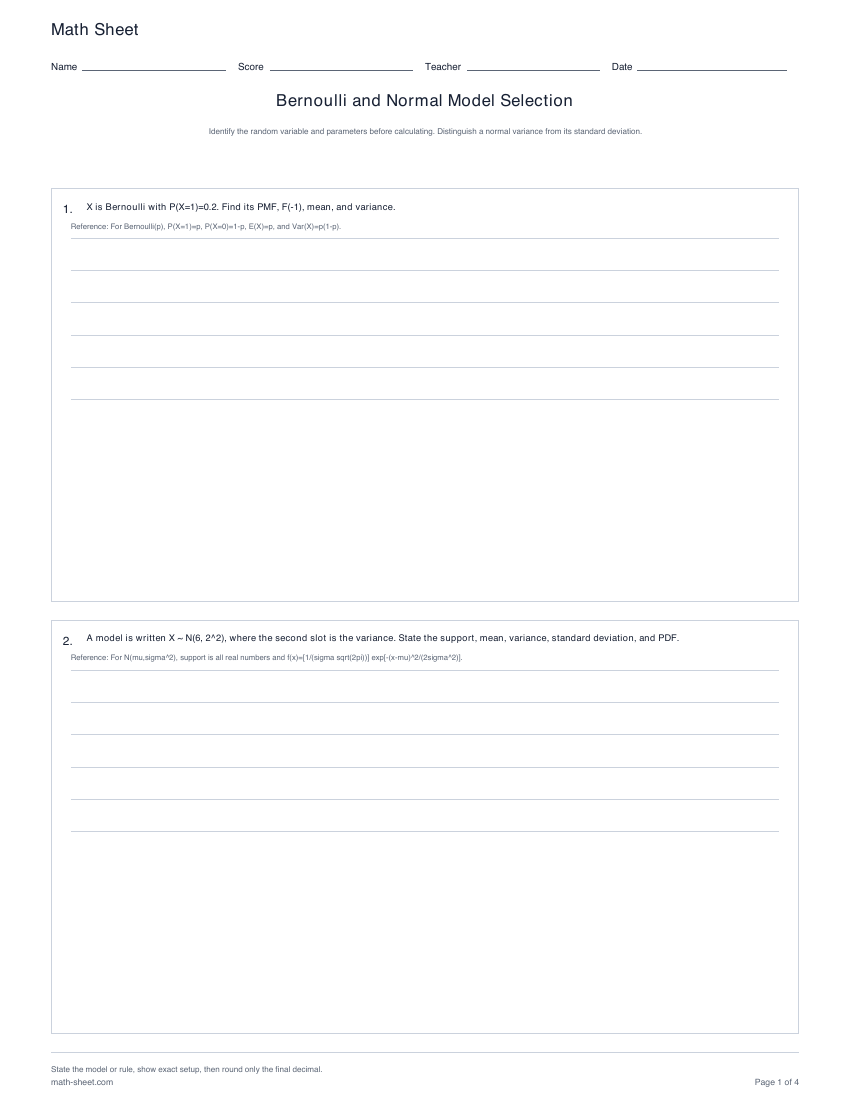
Probability
Distinguish Bernoulli from binomial counts and identify normal support, PDF parameters, variance, and standard deviation.
Preview and download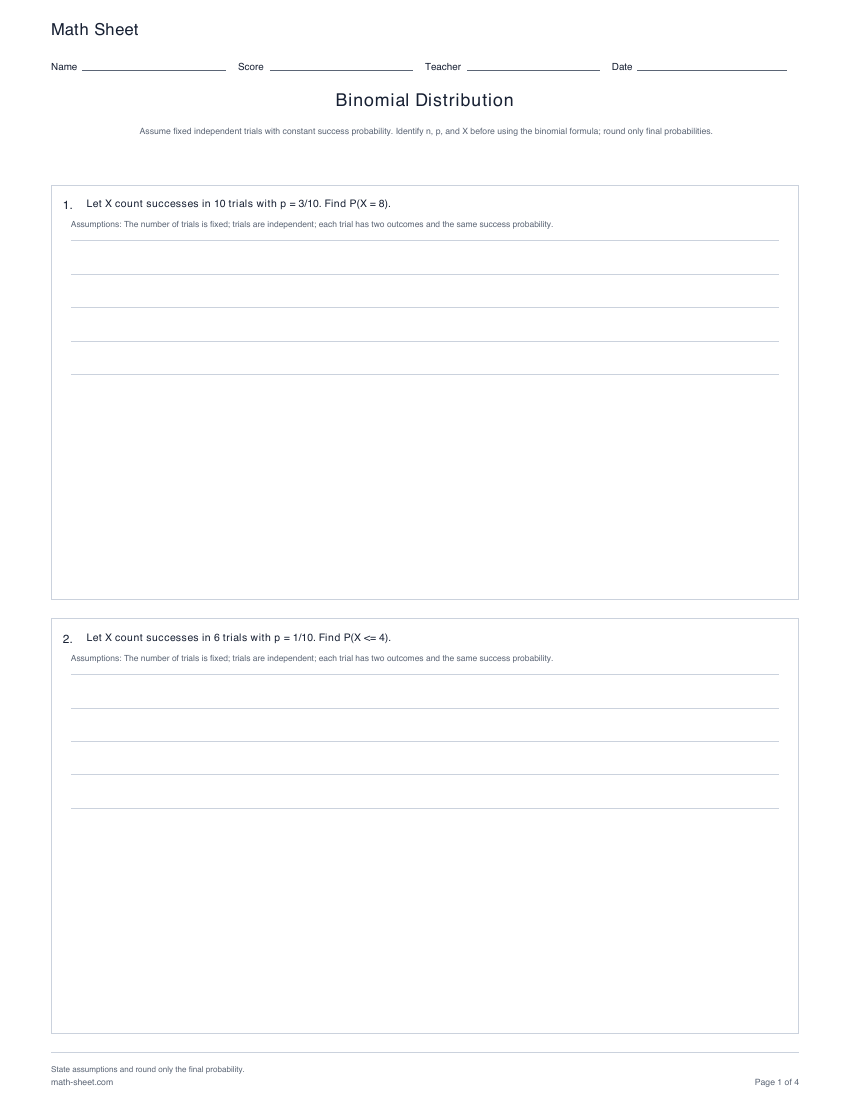
Probability
Calculate exact, at-most, and at-least binomial probabilities plus mean and variance for bounded trial counts.
Preview and download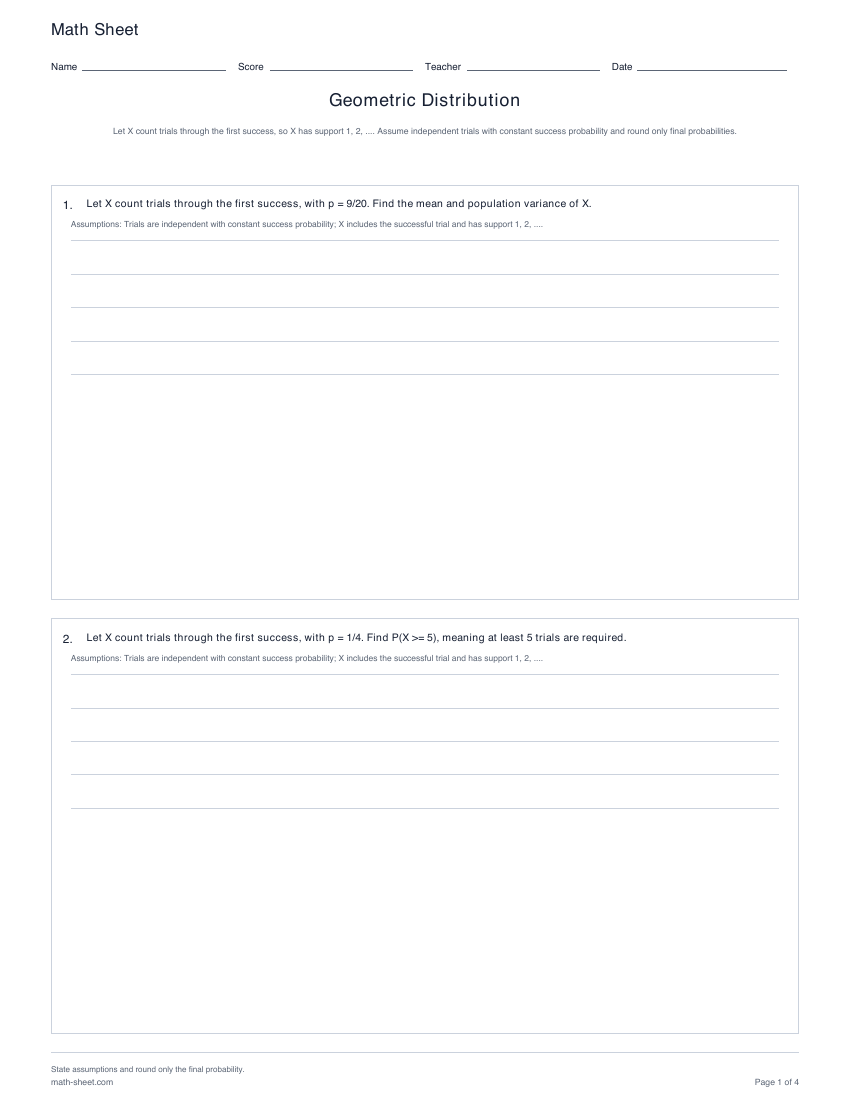
Probability
Model the number of trials through the first success using exact, cumulative, tail, mean, and variance questions.
Preview and download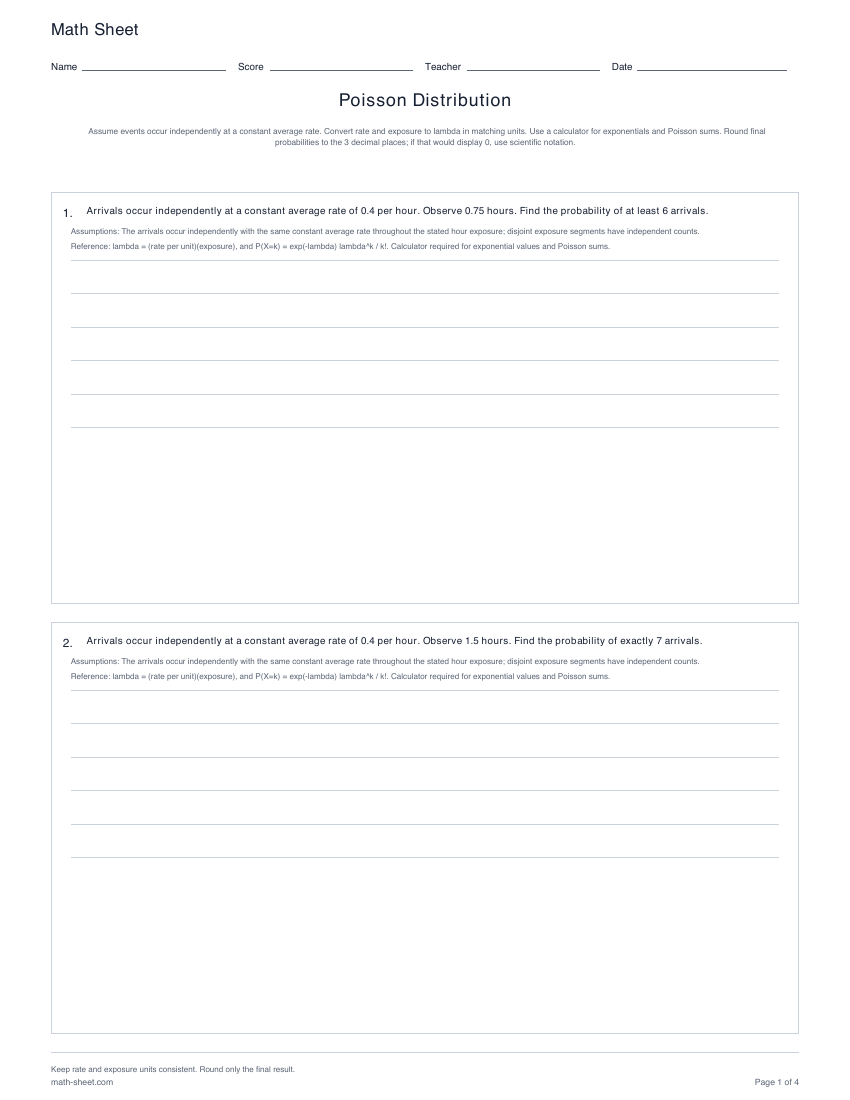
Probability
Scale a constant event rate to an exposure, then calculate exact, cumulative, tail, mean, and variance results for Poisson counts.
Preview and downloadStep 3
Probability is area. Include support boundaries, normalize the density and account for every preimage when transforming a variable.
Probability
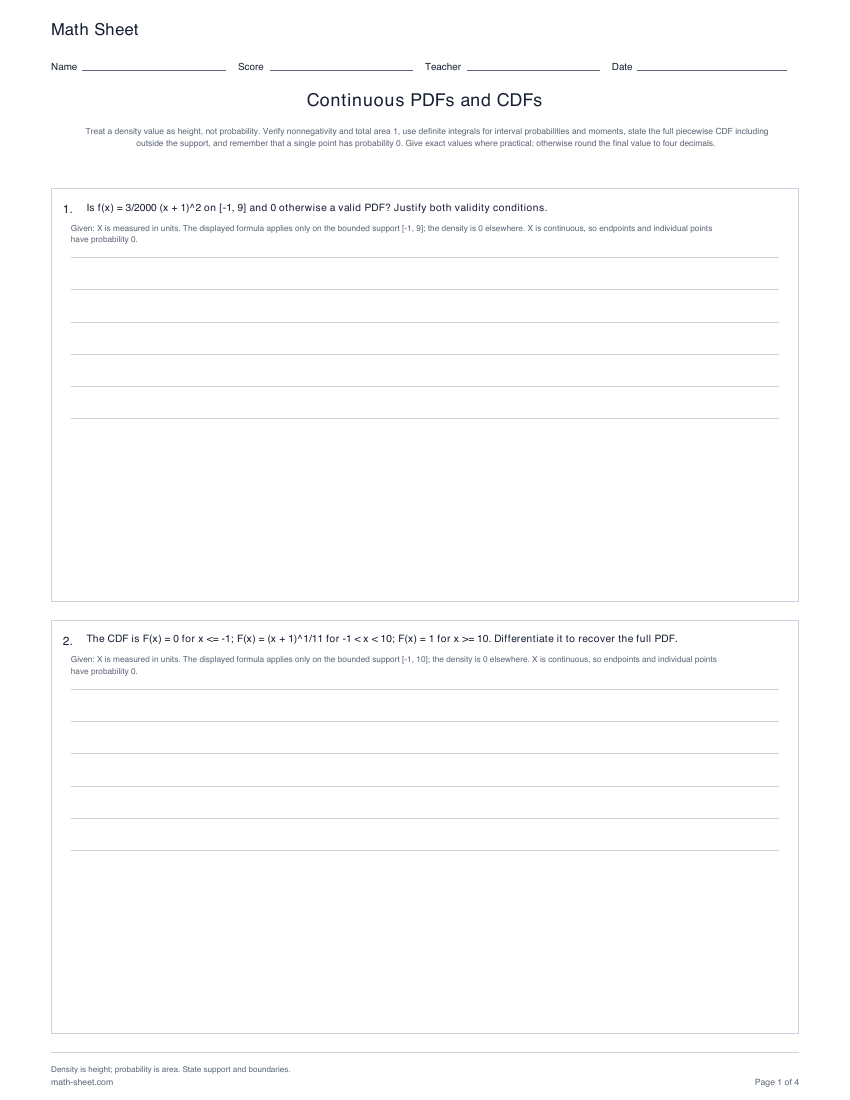
Normalize bounded polynomial densities, integrate probabilities and moments, build piecewise CDFs, recover PDFs, and invert CDFs for quantiles.
Preview and download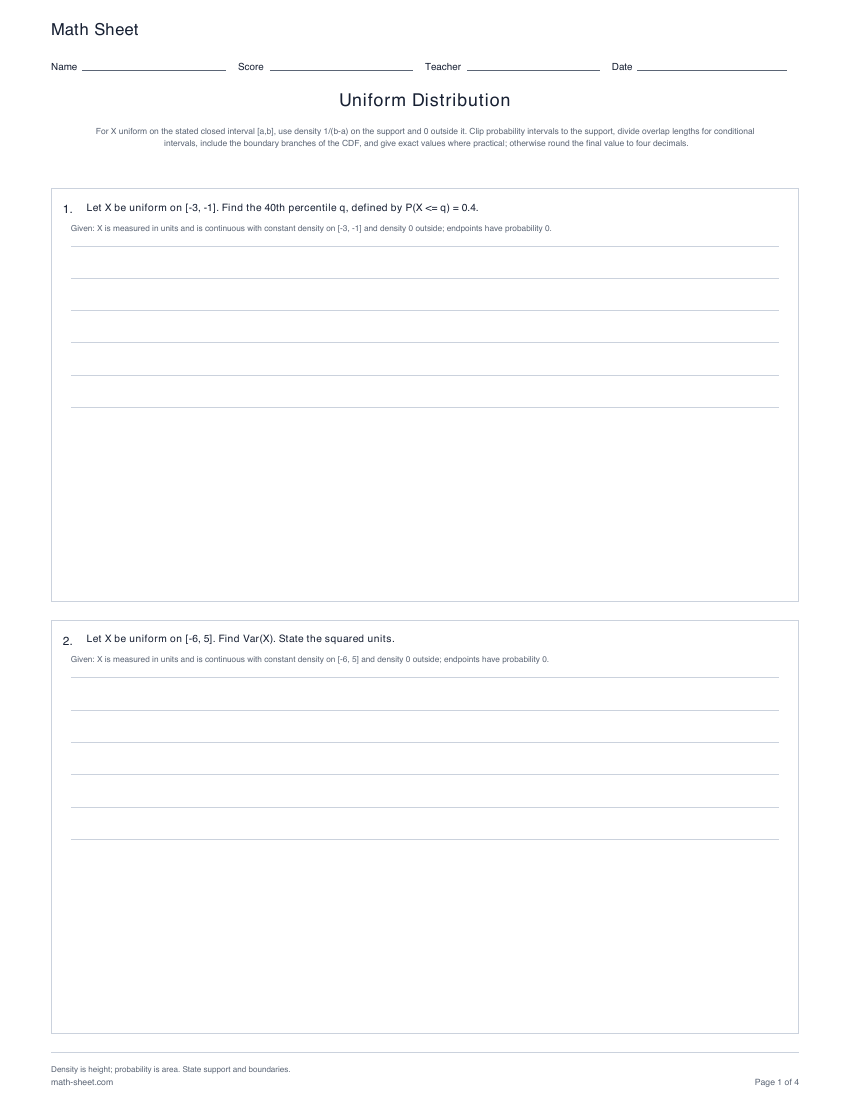
Probability
Use support length for density, clipped interval and conditional probabilities, piecewise CDFs, quantiles, mean, and variance.
Preview and download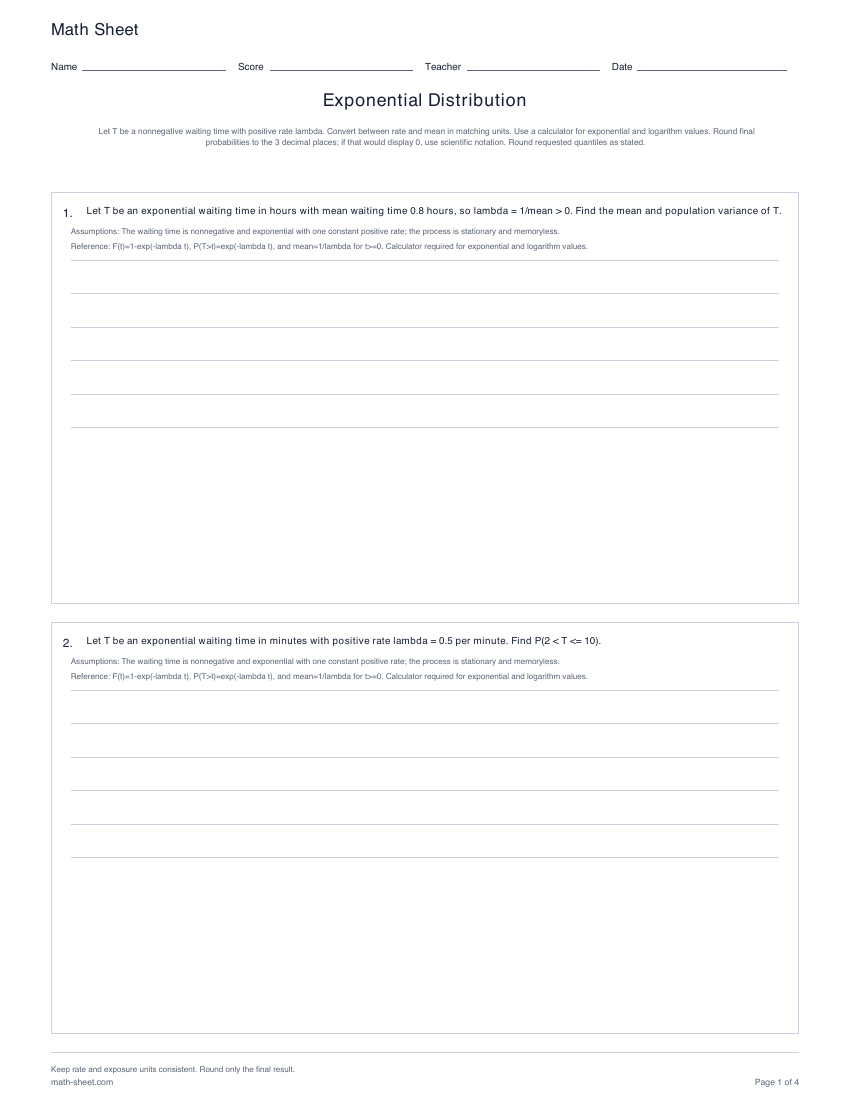
Probability
Work with exponential waiting-time CDFs, survival probabilities, intervals, quantiles, moments, rate-mean conversion, and memorylessness.
Preview and download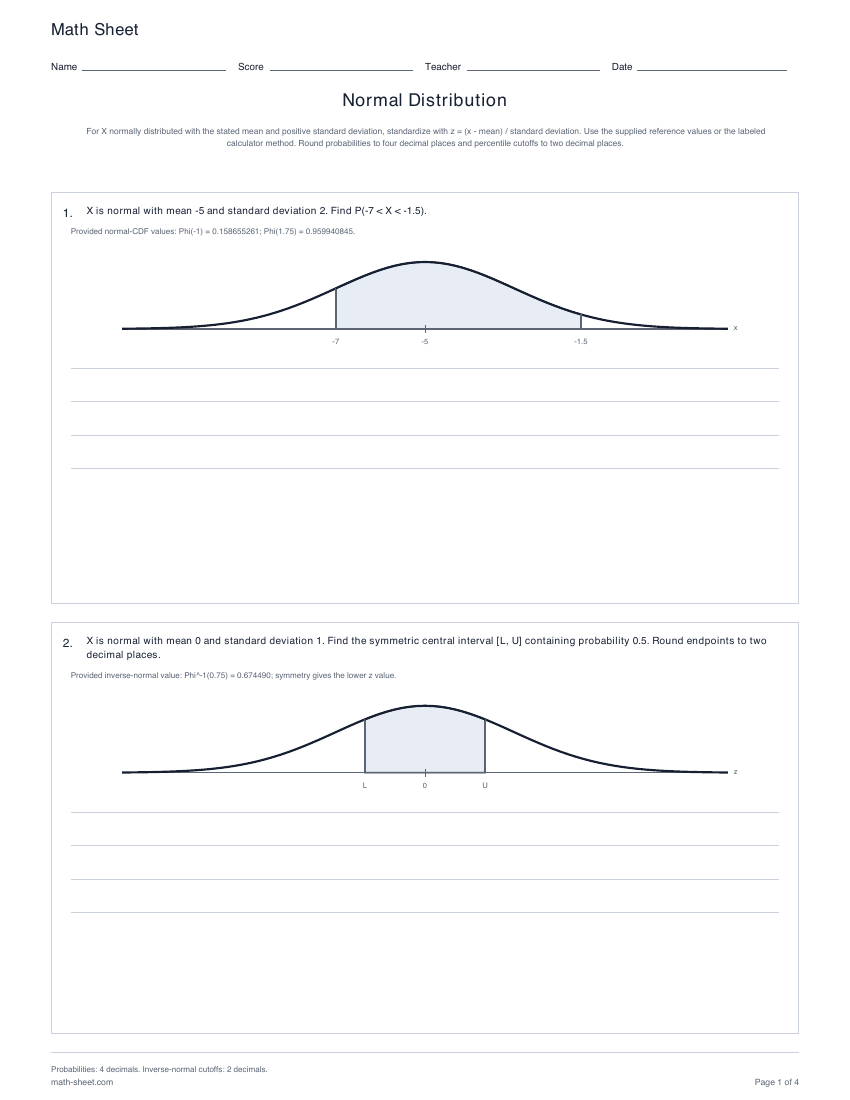
Statistics
Standardize normal values, find below, above, and between probabilities, and invert the model for percentiles and central intervals.
Preview and download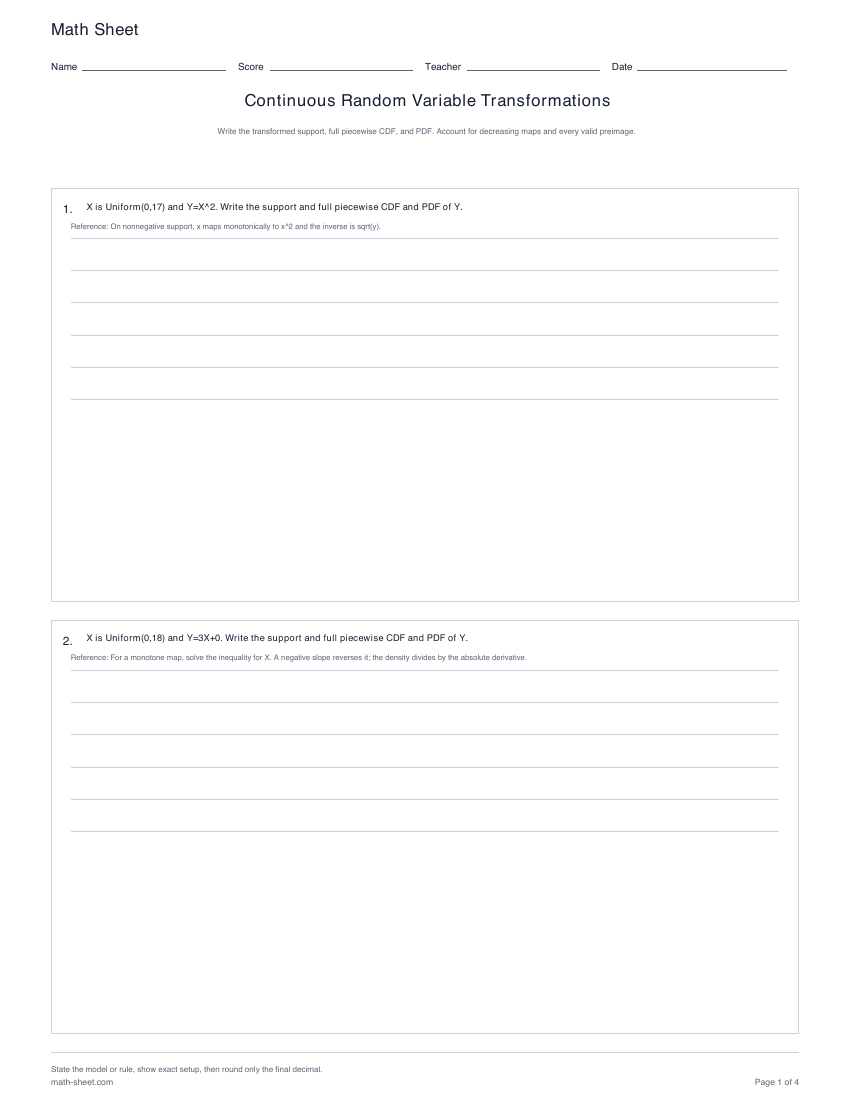
Probability
Transform supports, CDFs, and PDFs for affine, square, square-root, and two-preimage mappings.
Preview and downloadStep 4
Derive marginals and conditional distributions, calculate covariance, and distinguish LLN concentration from a CLT approximation.
Probability
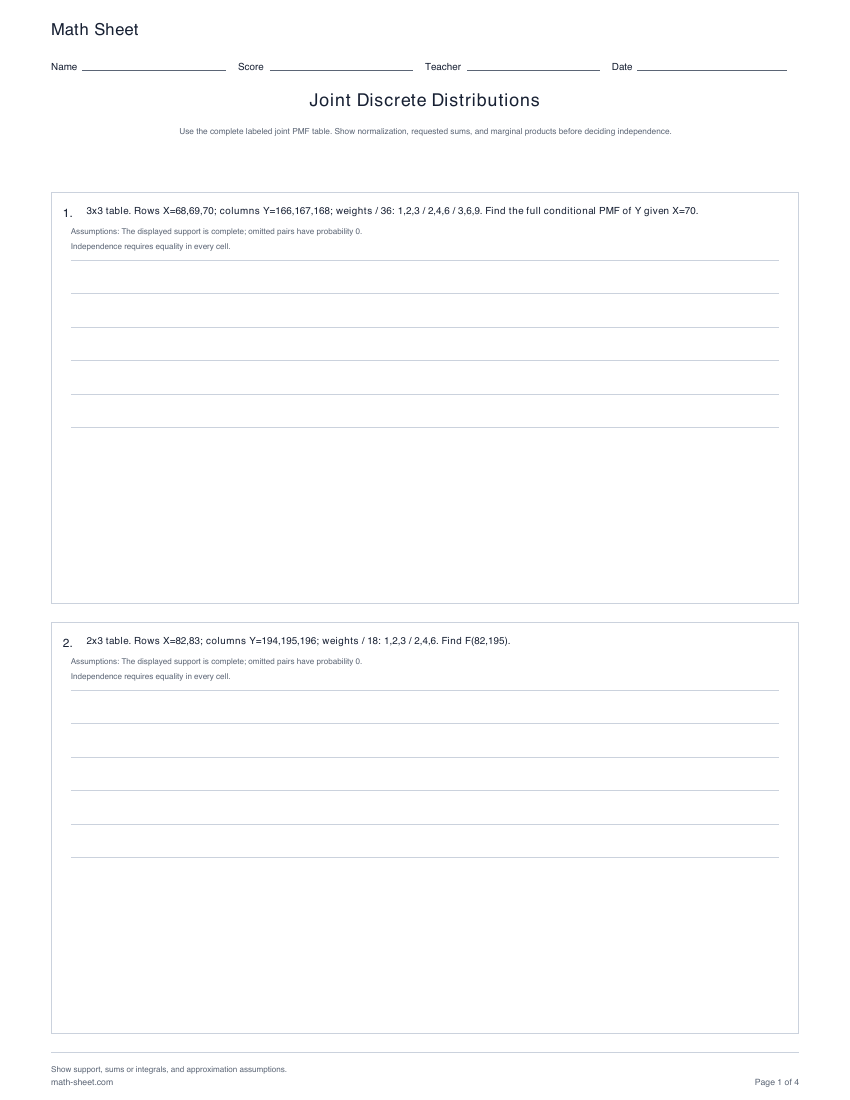
Use numeric joint PMF tables for CDFs, events, marginals, conditionals, moments, and independence.
Preview and download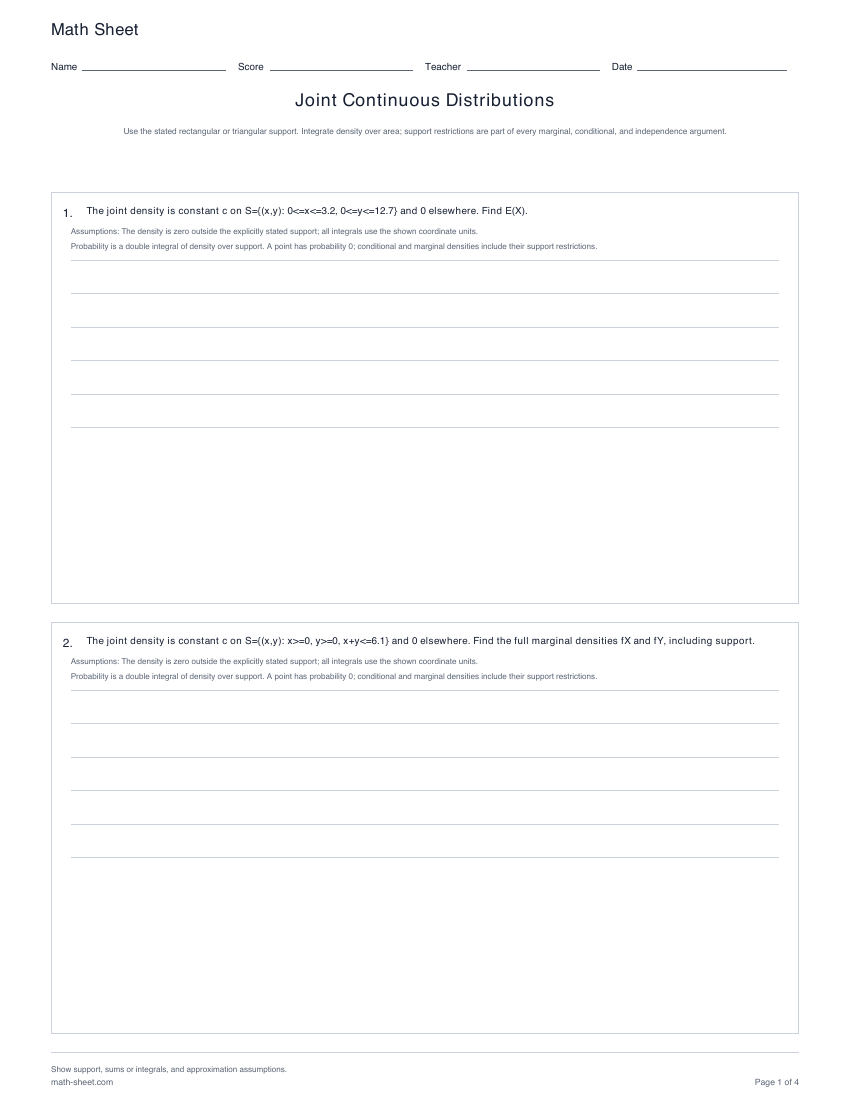
Probability
Integrate densities on rectangular and triangular supports for probabilities, CDFs, marginals, conditionals, and independence.
Preview and download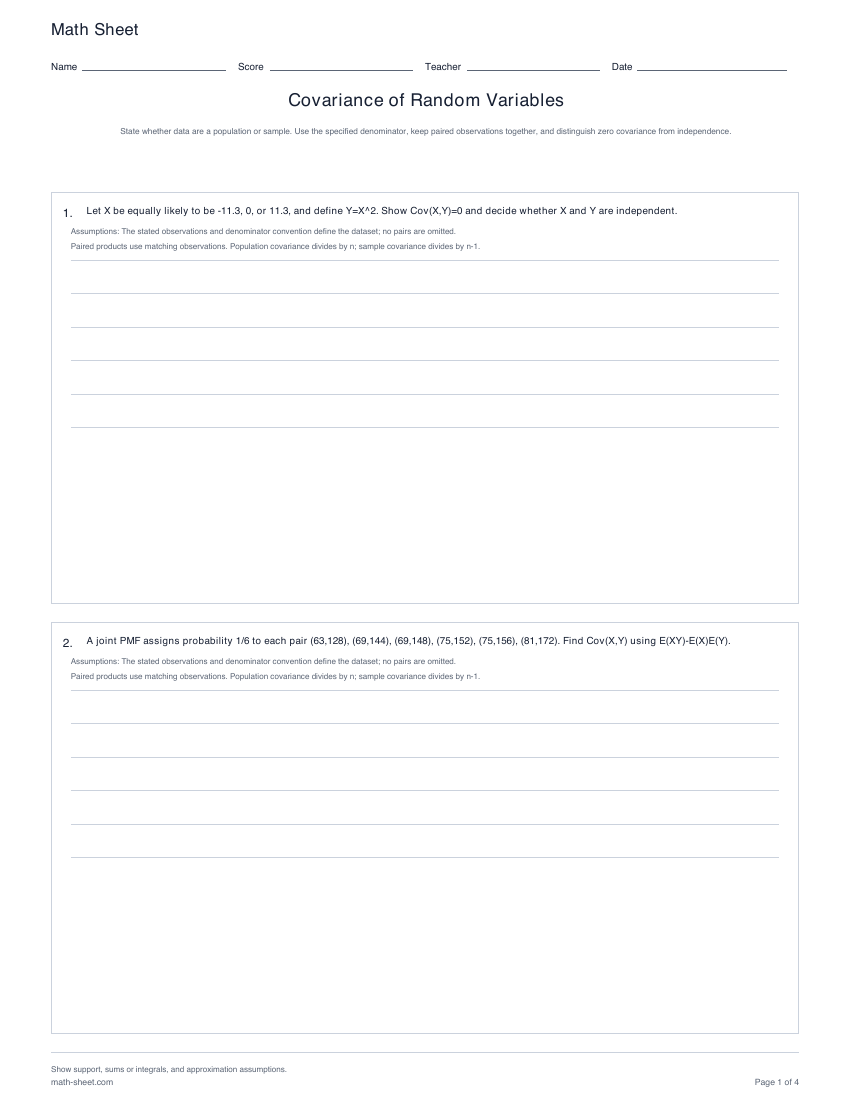
Probability
Calculate covariance and correlation from joint PMFs or paired data with explicit denominators.
Preview and download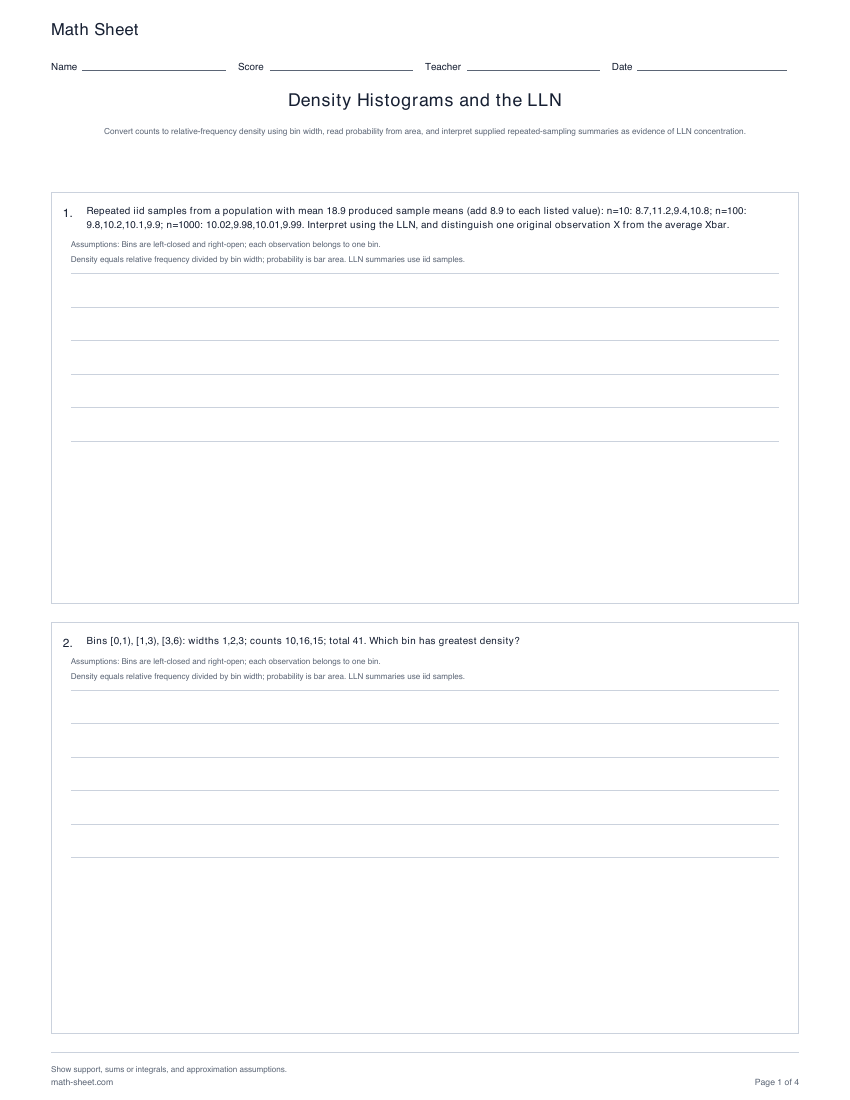
Probability
Convert unequal-width bin counts to density and area, then interpret supplied repeated-sampling summaries.
Preview and download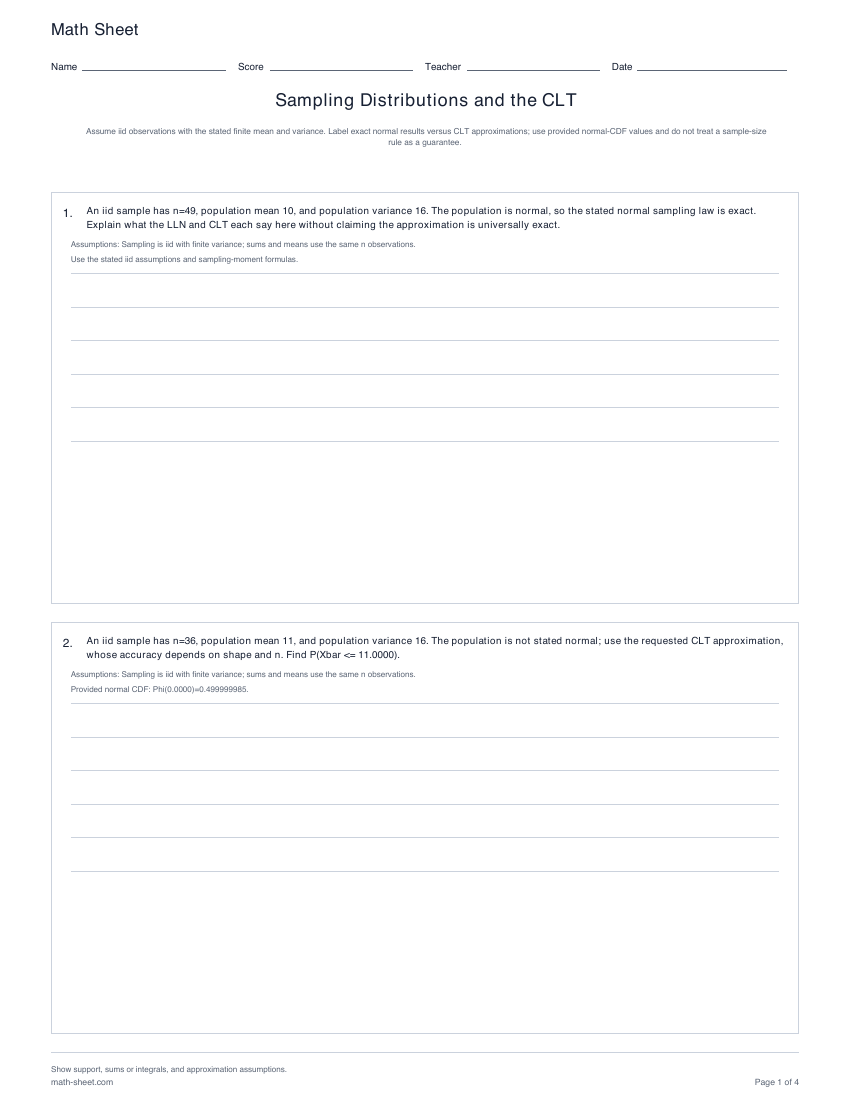
Probability
Find moments and probabilities for means and sums, distinguish exact normal results from CLT approximations, and use continuity correction.
Preview and downloadStep 5
Separate a parameter from a statistic, compare likelihoods, update prior information and interpret posterior prediction and credible intervals.
Statistics
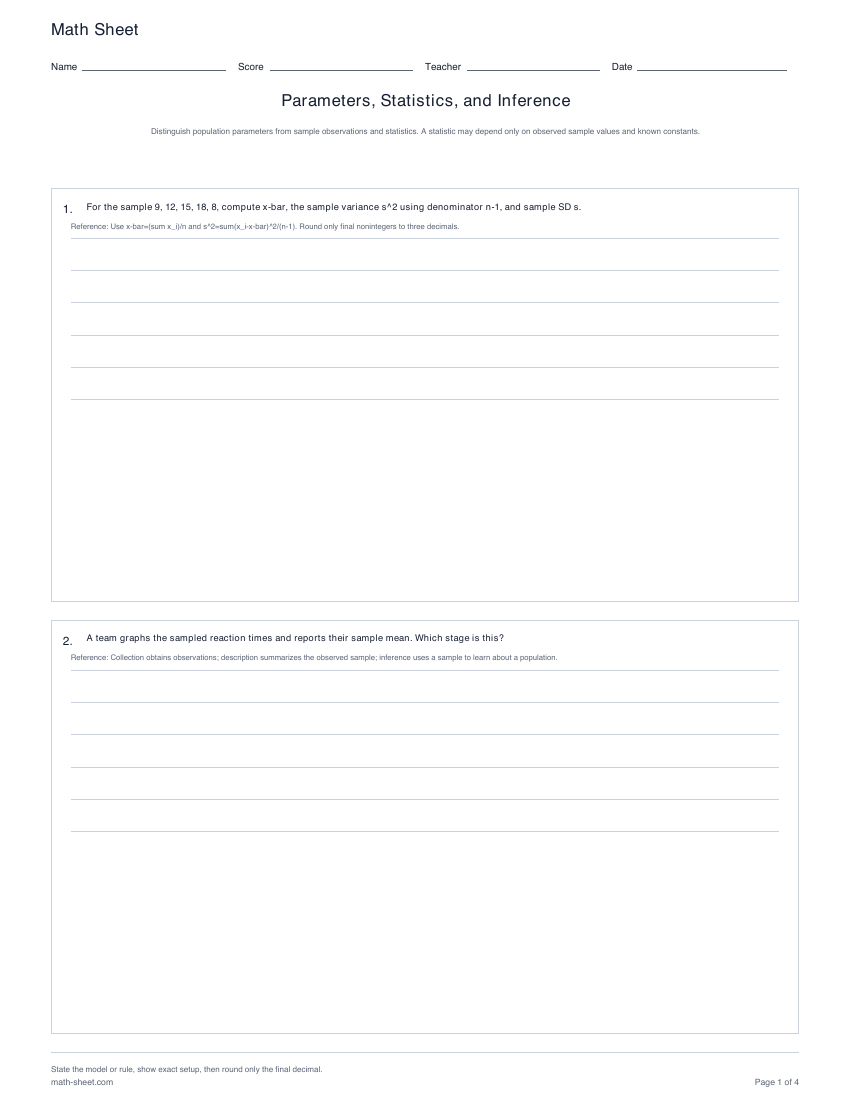
Classify study stages, identify observations and parameters, reject invalid statistics, and compute sample summaries.
Preview and download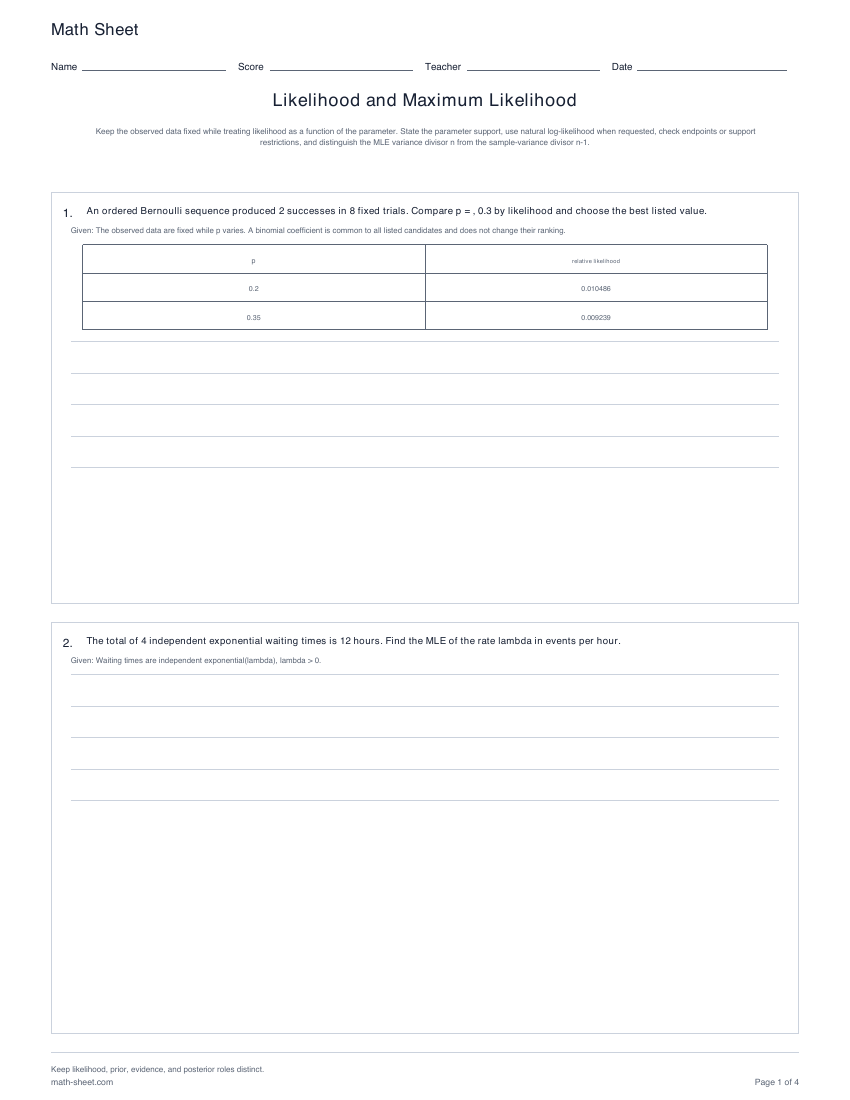
Statistics
Write and compare likelihoods, find bounded analytic MLEs, and handle normal variance and support-dependent uniform endpoints.
Preview and download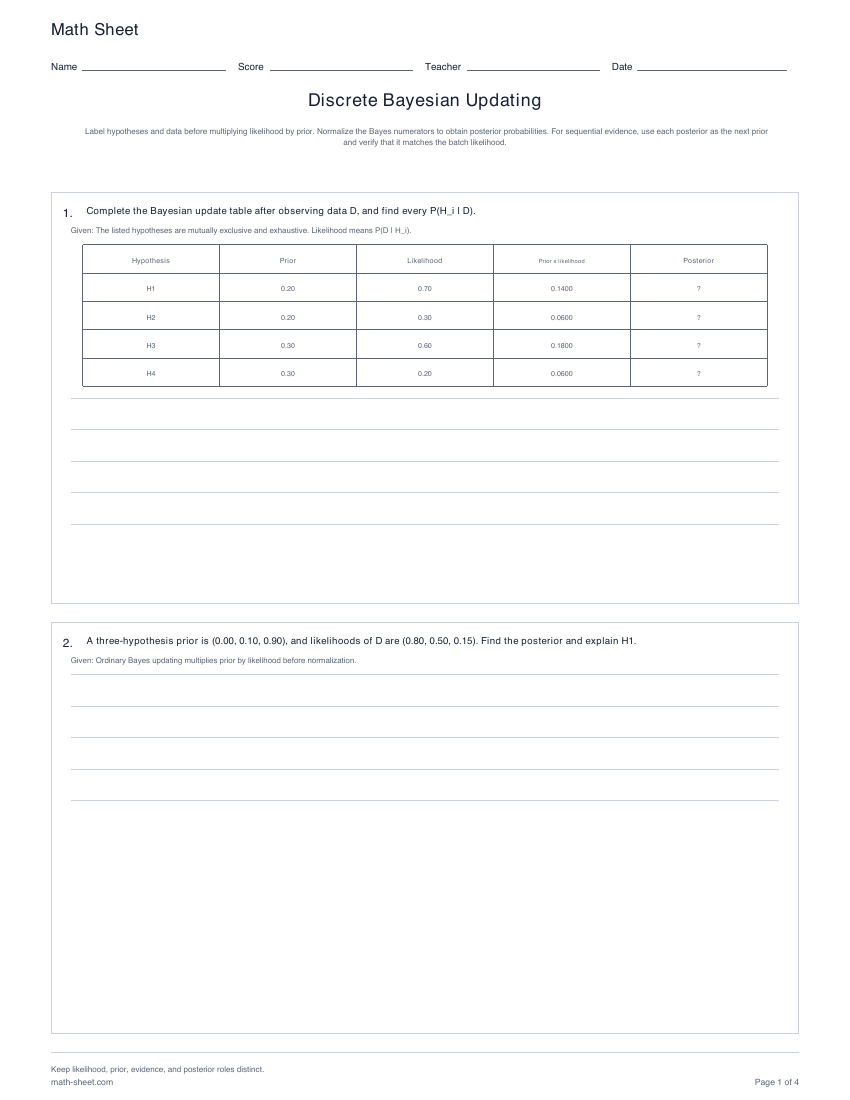
Statistics
Complete prior-likelihood-posterior tables, compare sequential and batch evidence, and handle zero priors or impossible evidence.
Preview and download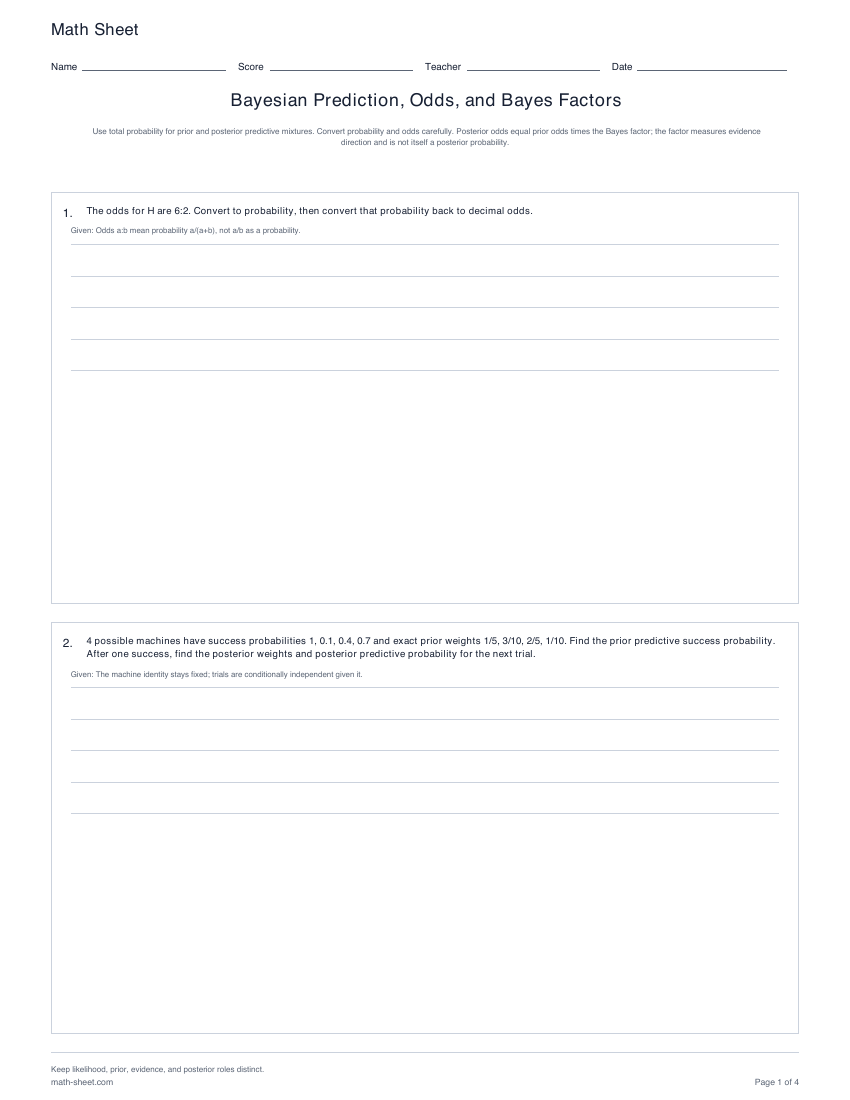
Statistics
Form predictive mixtures, convert odds and probability, update odds with Bayes factors, and interpret evidence direction.
Preview and download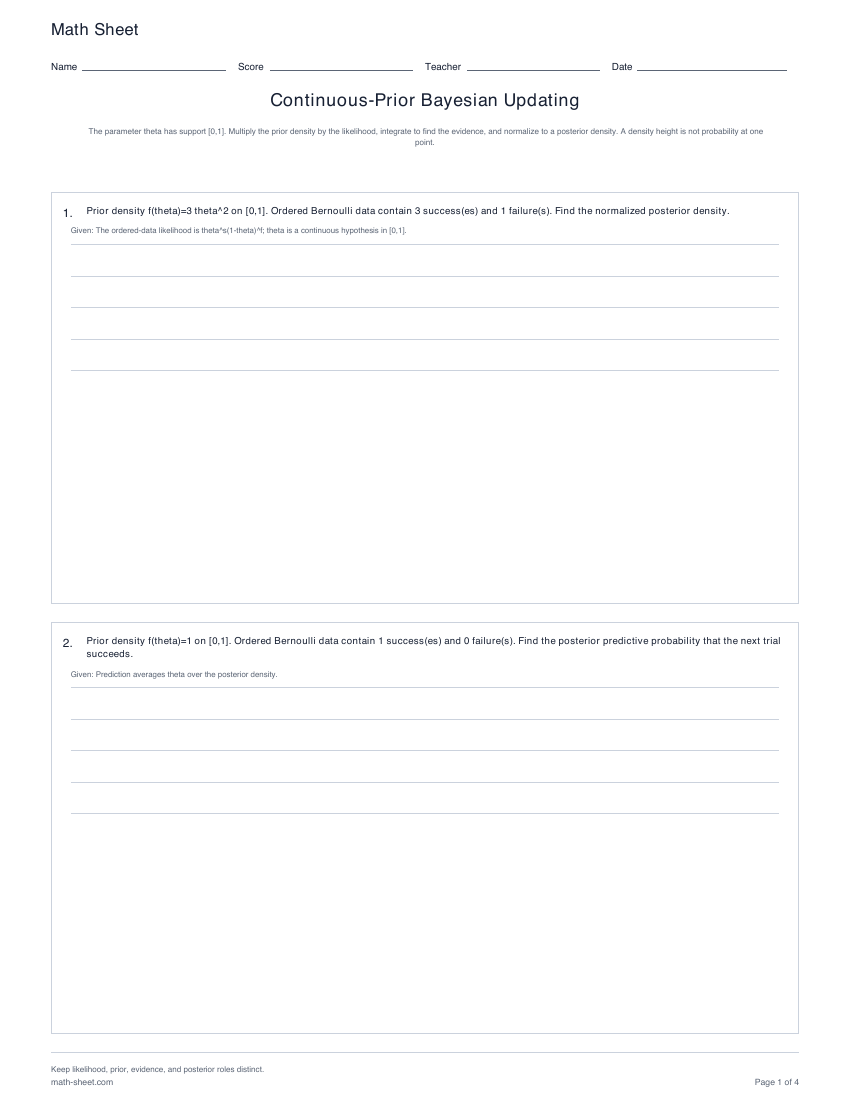
Statistics
Normalize polynomial prior-likelihood products, integrate evidence, predict future outcomes, and distinguish density from point mass.
Preview and download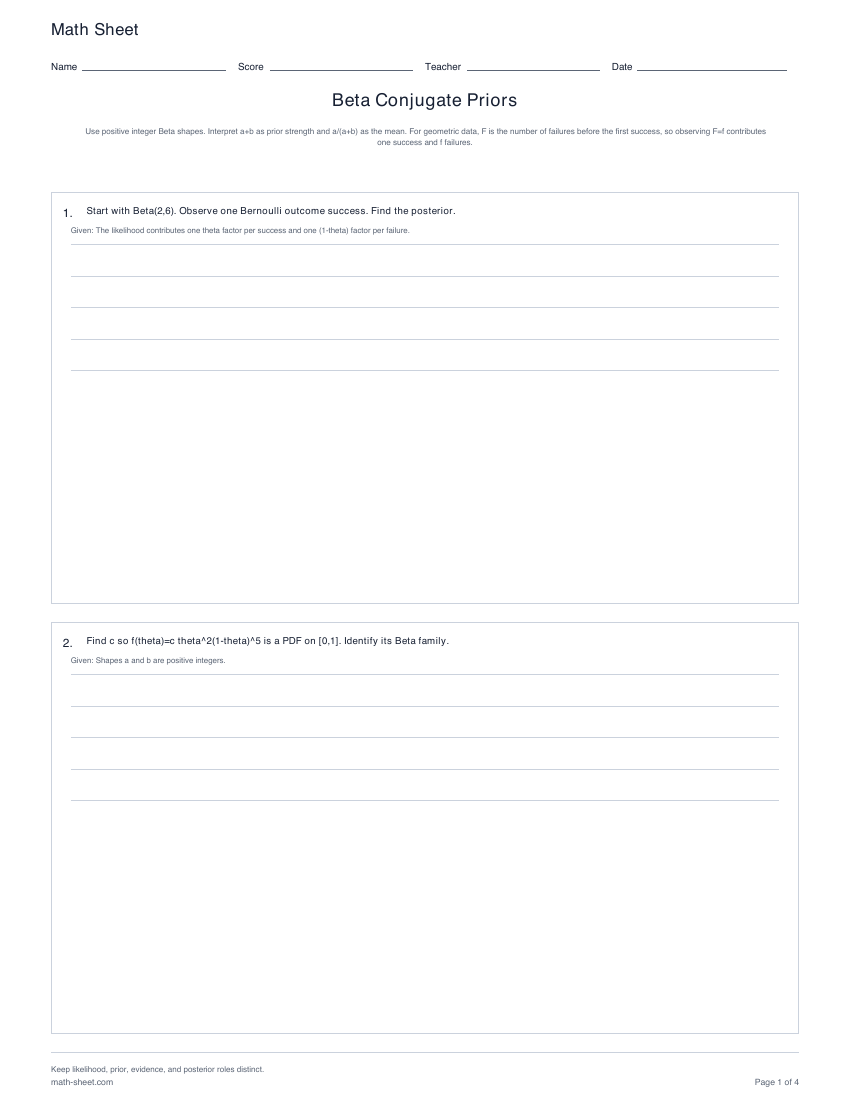
Statistics
Normalize integer-shape Beta densities, interpret strength, update Bernoulli/binomial/geometric data, and predict.
Preview and download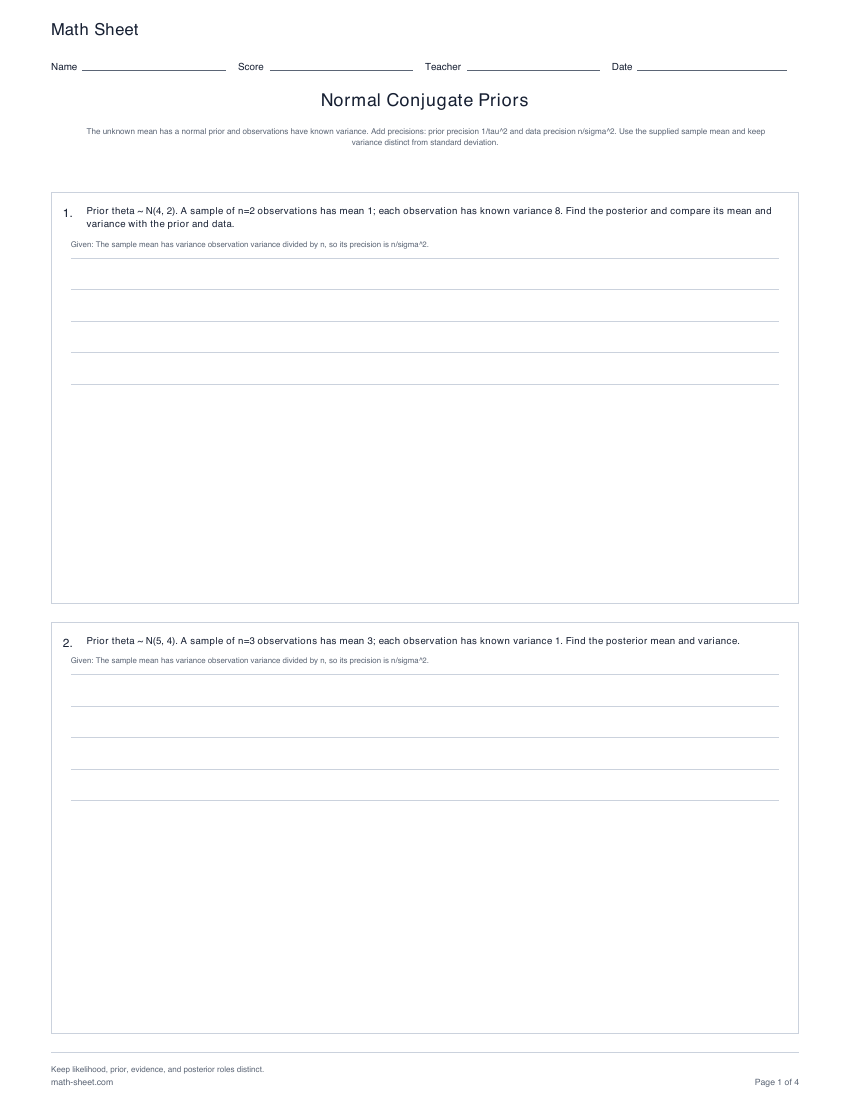
Statistics
Update a normal mean with known observation variance using precision weights and verify sequential consistency.
Preview and download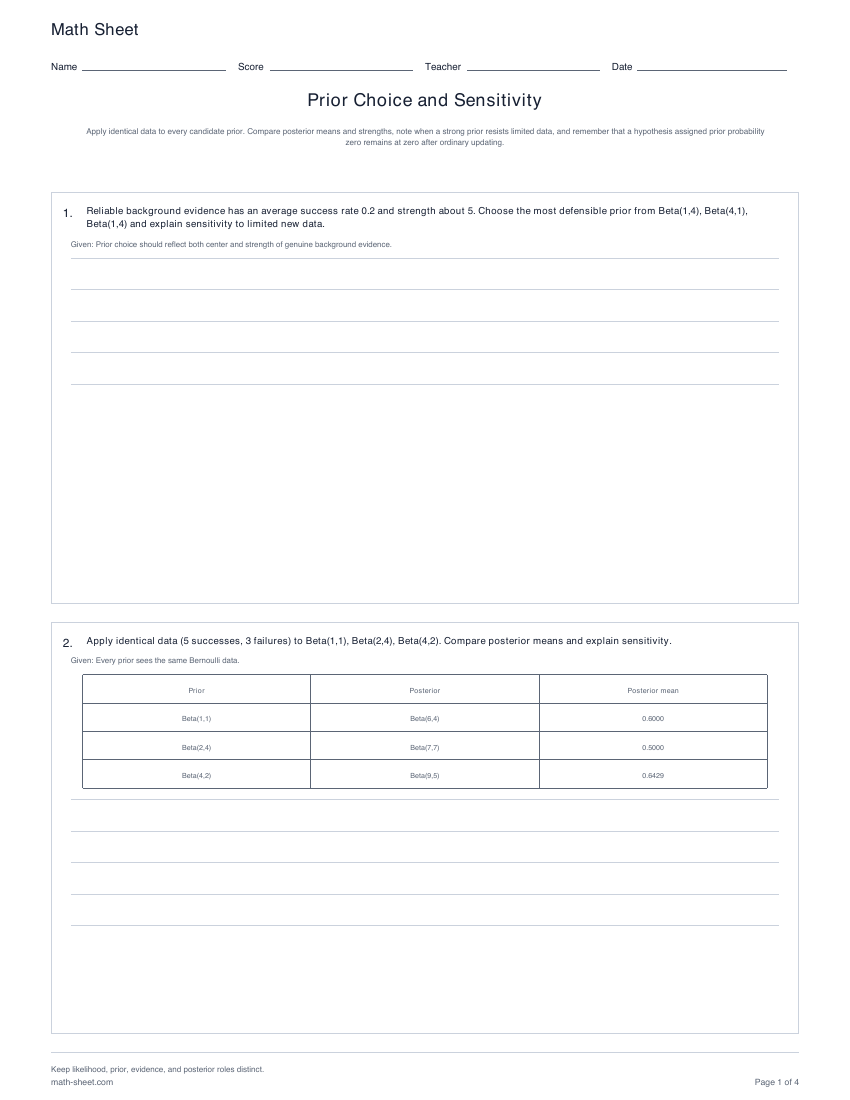
Statistics
Compare priors under identical data, contrast weak and strong priors, preserve zero prior mass, and justify prior choices.
Preview and download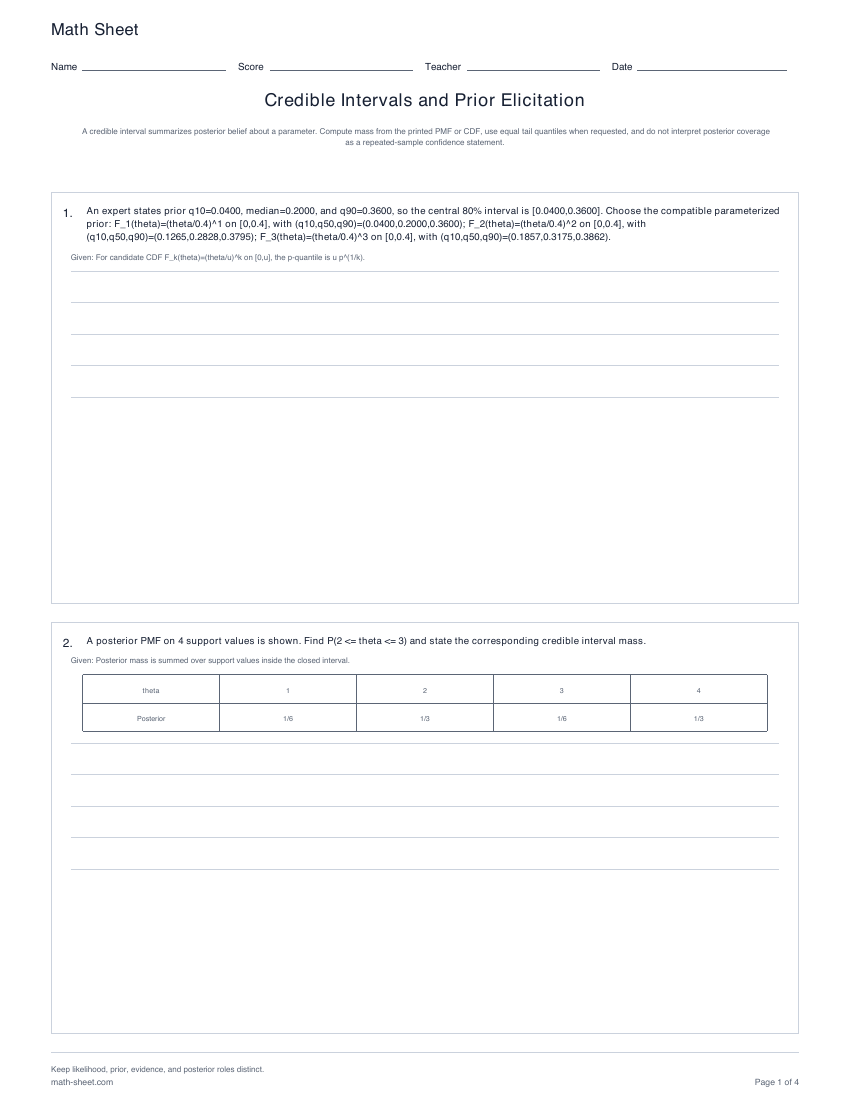
Statistics
Calculate discrete and continuous posterior interval mass, equal-tail intervals, interpretations, and quantile-based prior choices.
Preview and downloadStep 6
Specify hypotheses, assumptions and an extremeness rule before calculating. Keep p-values, error rates and posterior probabilities distinct.
Statistics
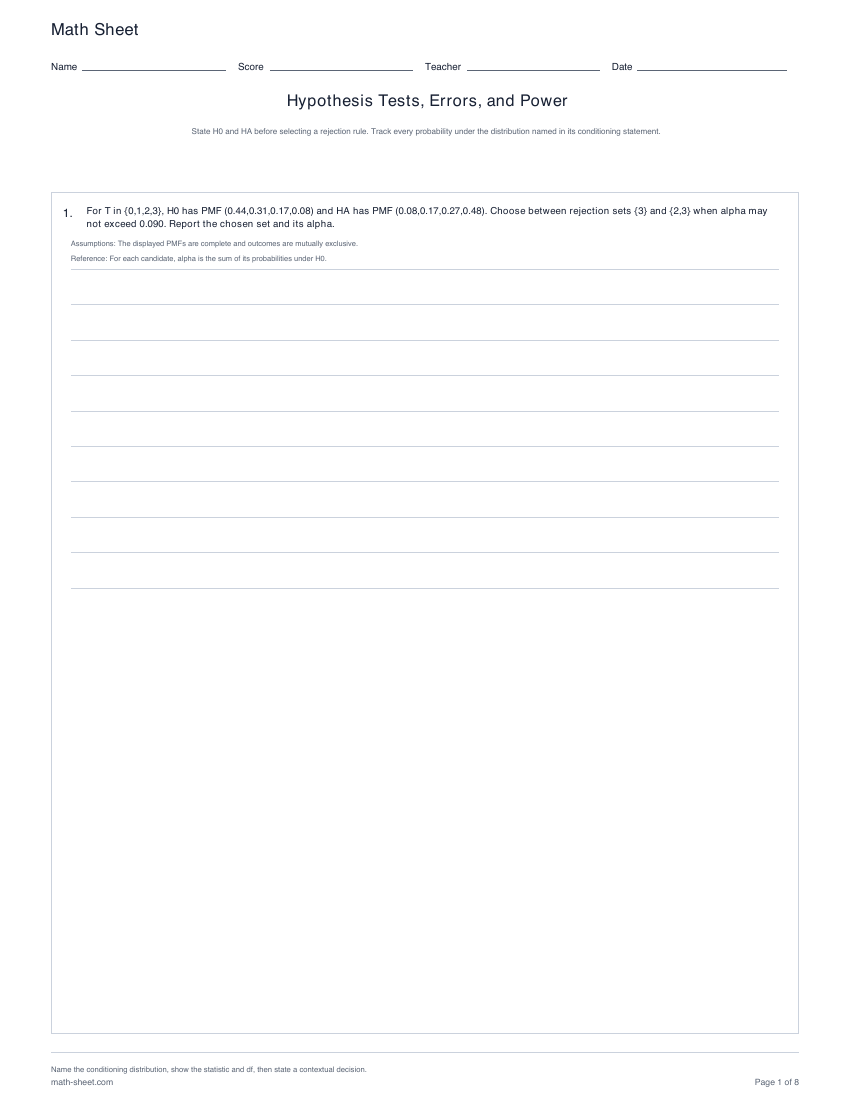
Design null and alternative hypotheses, choose rejection sets, and compute Type I error, Type II error, and power.
Preview and download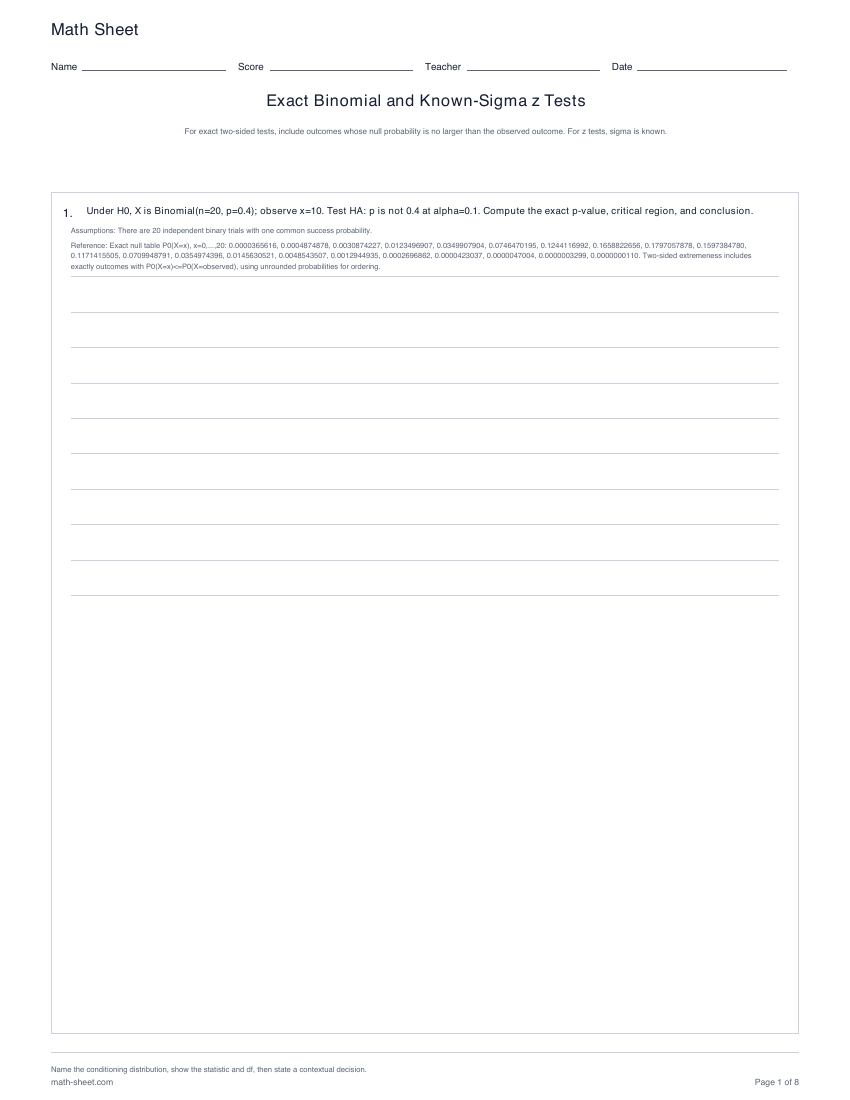
Statistics
Run exact one- and two-sided binomial tests and known-sigma z tests from raw data or summaries.
Preview and download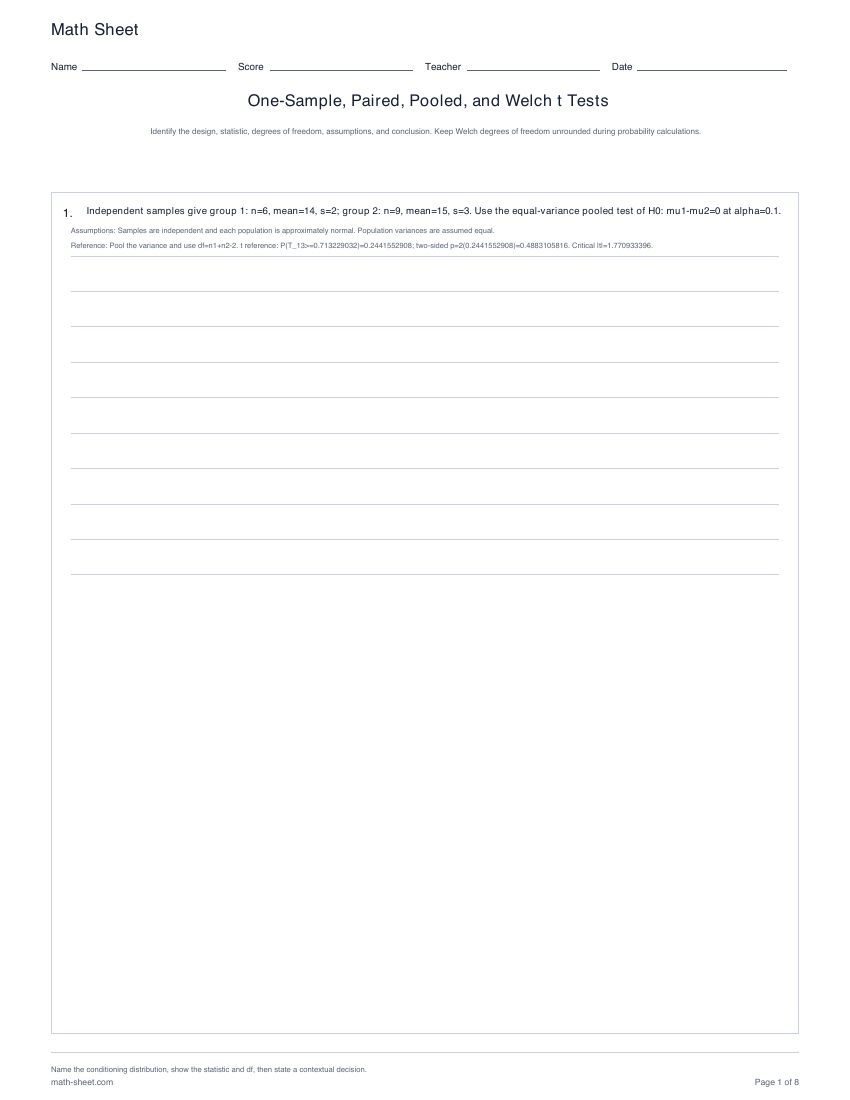
Statistics
Select and run one-sample, paired, equal-variance pooled, and unequal-variance Welch t tests.
Preview and download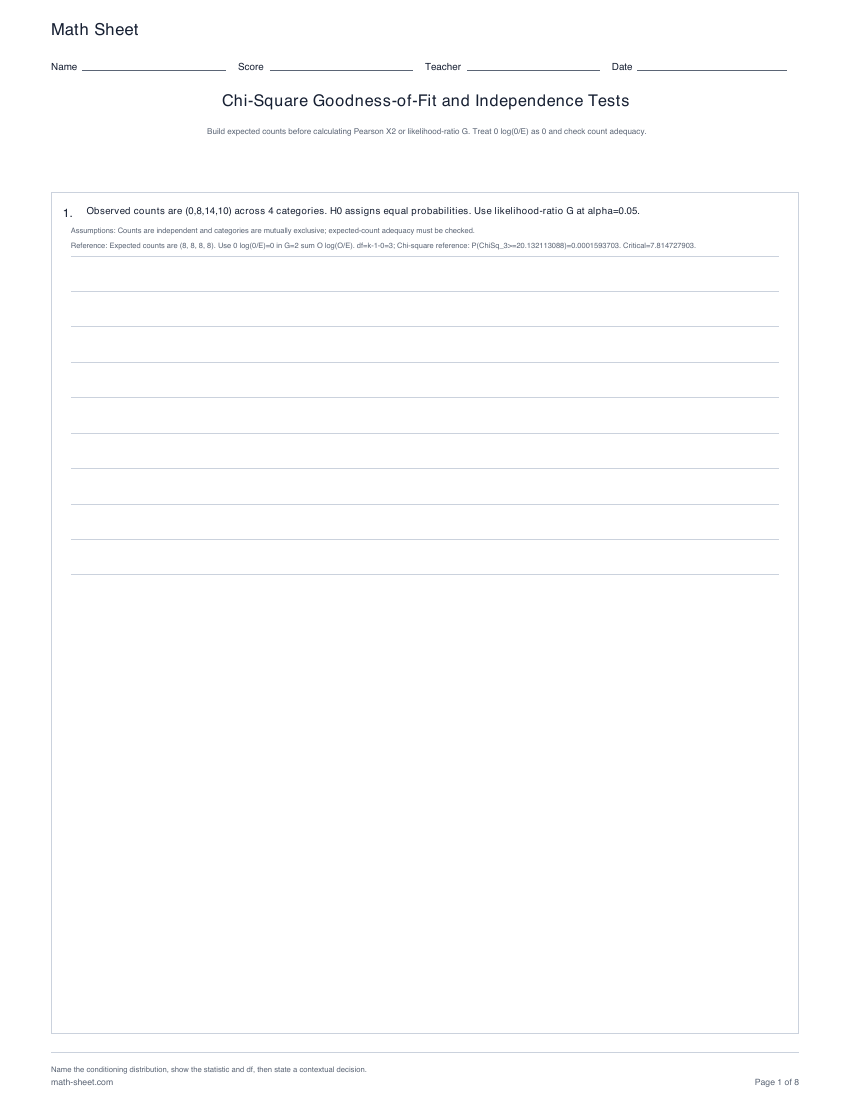
Statistics
Build expected counts and calculate Pearson X2 or likelihood-ratio G for categorical data.
Preview and download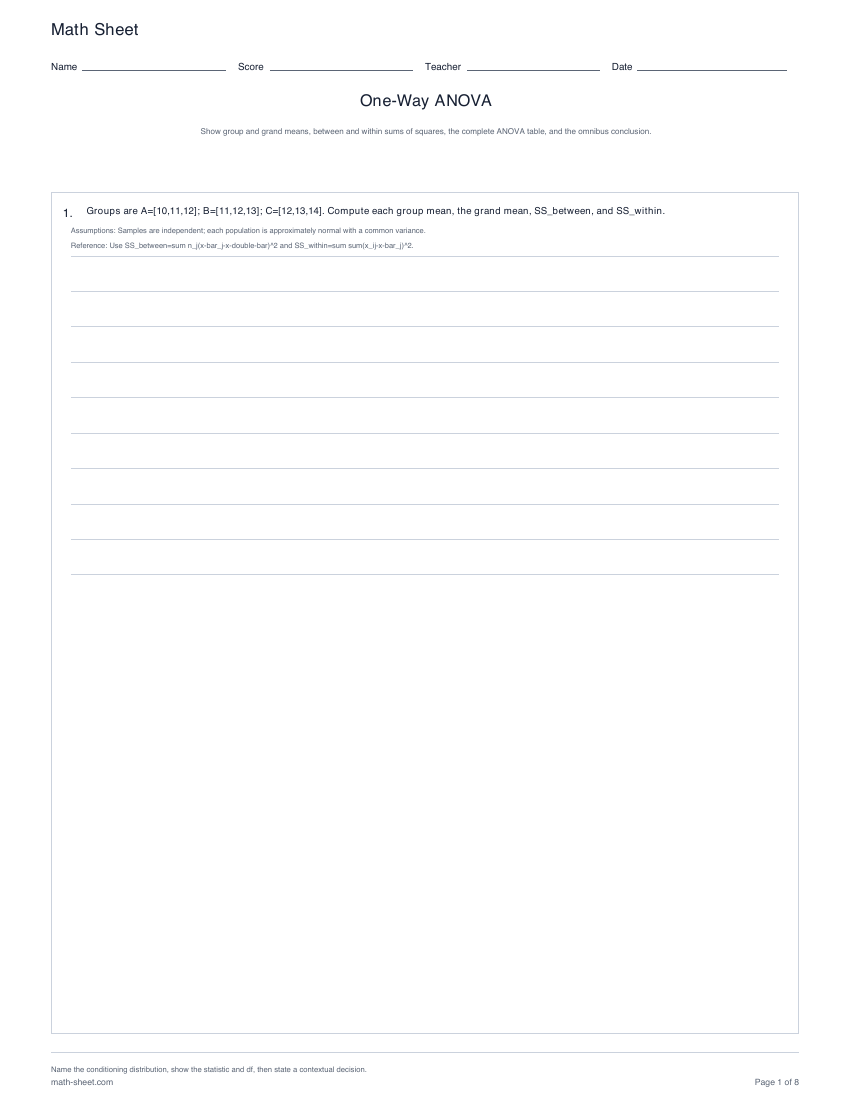
Statistics
Compute between and within sums of squares, complete ANOVA tables, and interpret omnibus F tests.
Preview and download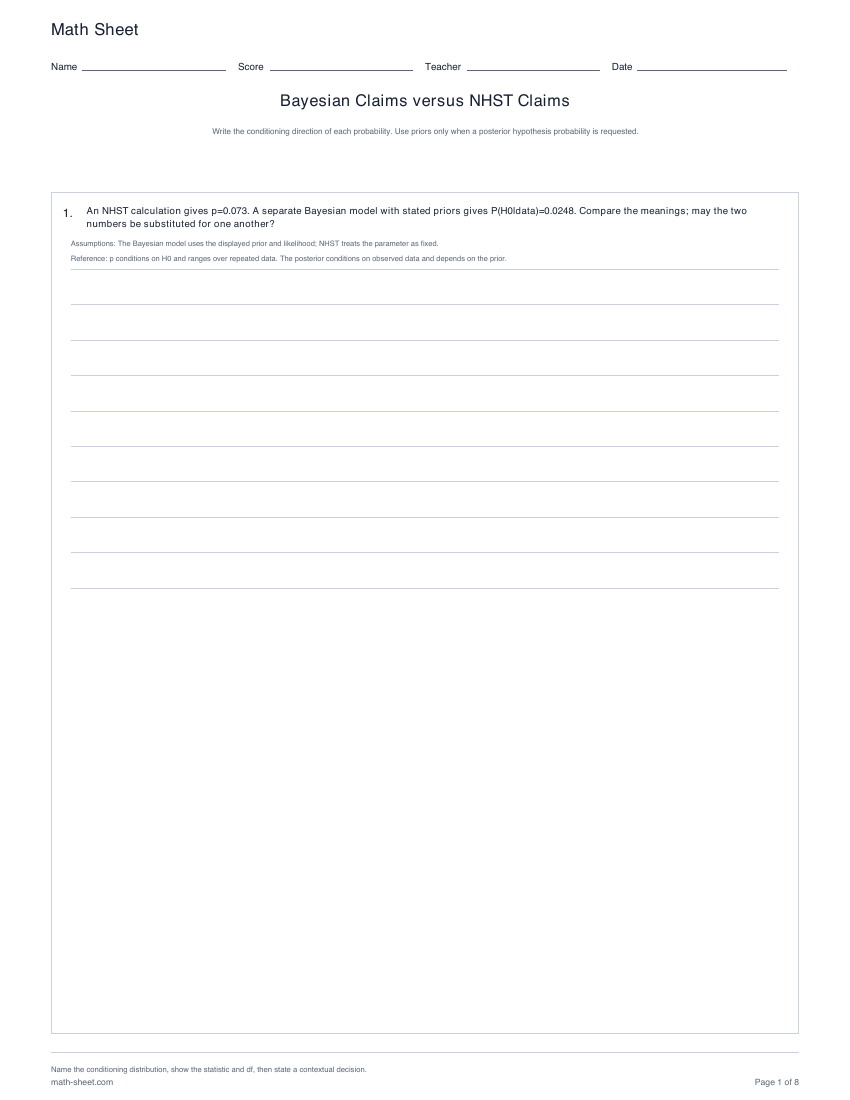
Statistics
Compare p-values, error rates, and posterior hypothesis probabilities without reversing their conditioning.
Preview and downloadStep 7
Use a sampling model or a clearly specified resampling procedure. Interpret repeated-sample coverage and the limits of small classroom bootstrap examples.
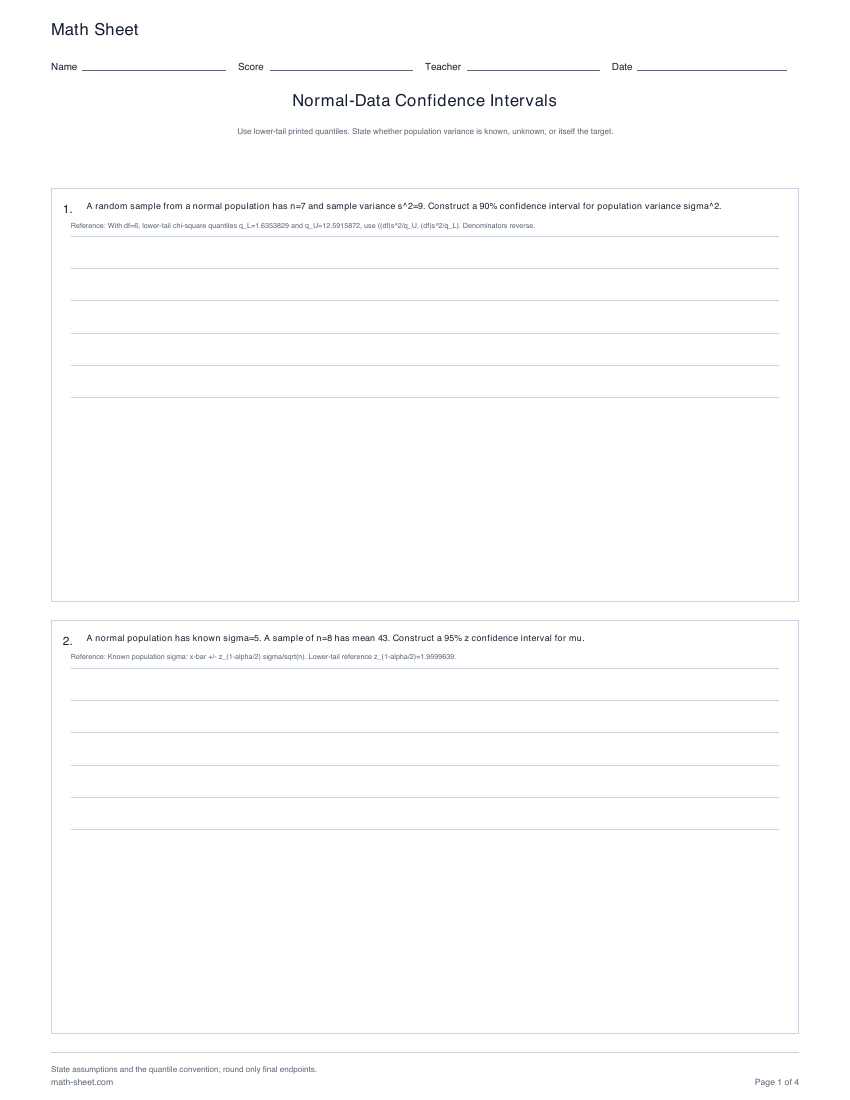
Statistics
Construct z and t mean intervals, chi-square variance intervals, inspect coverage, and invert a two-sided test.
Preview and download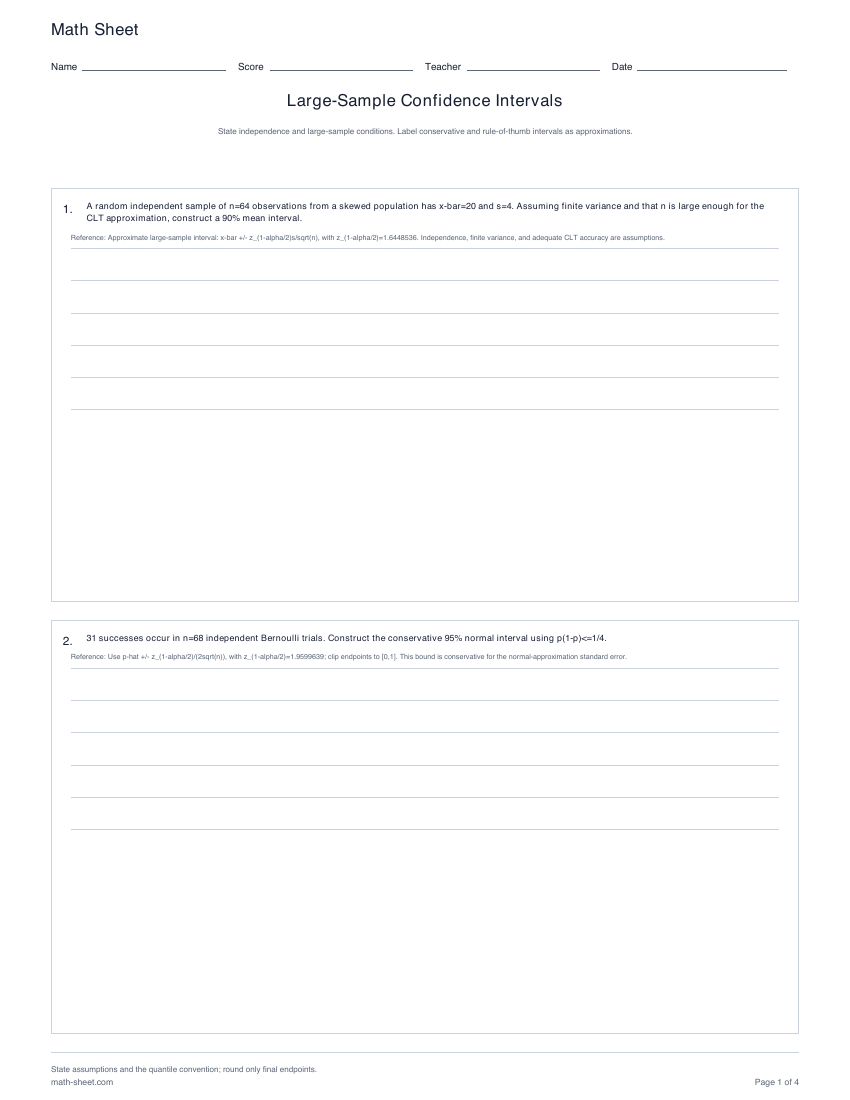
Statistics
Use conservative proportion bounds, the approximate 95% rule, and CLT intervals for general means.
Preview and download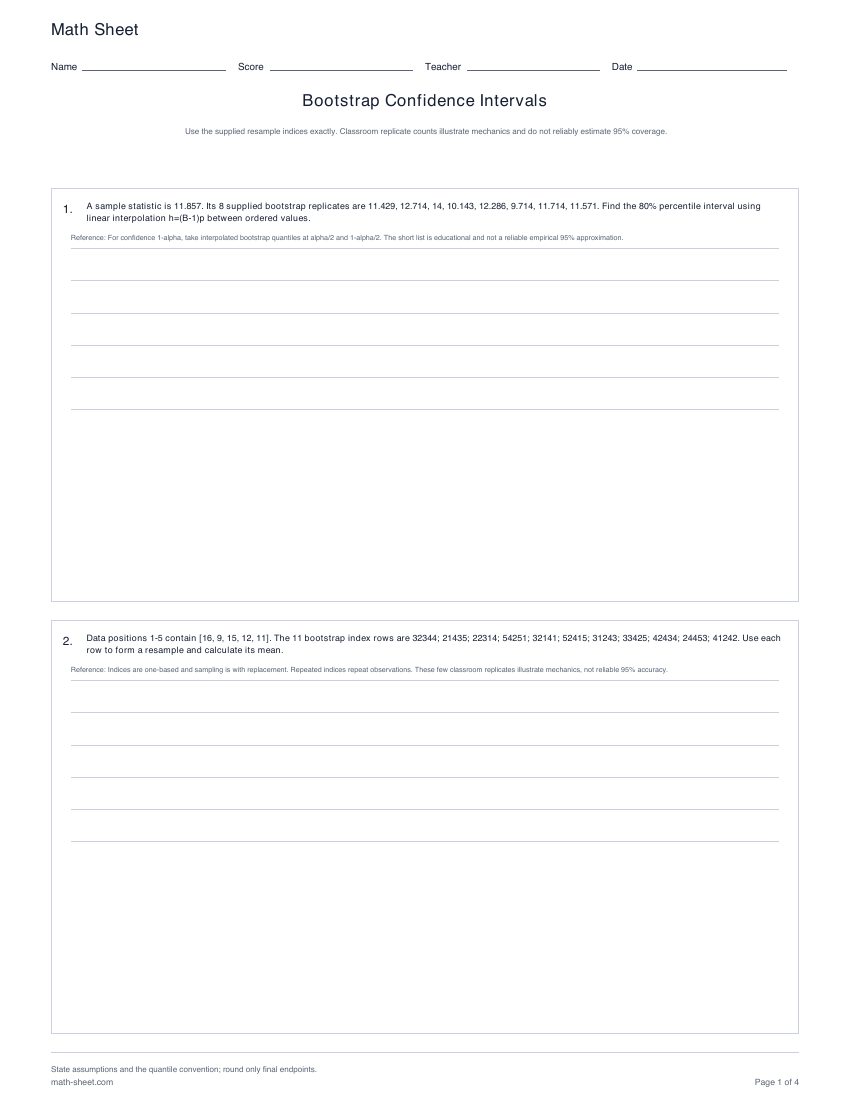
Statistics
Build empirical PMFs, calculate supplied resample statistics, and form percentile and basic bootstrap intervals.
Preview and downloadStep 8
Inspect paired data, calculate residuals and error, compare model complexity and interpret each predictor while holding the others fixed.
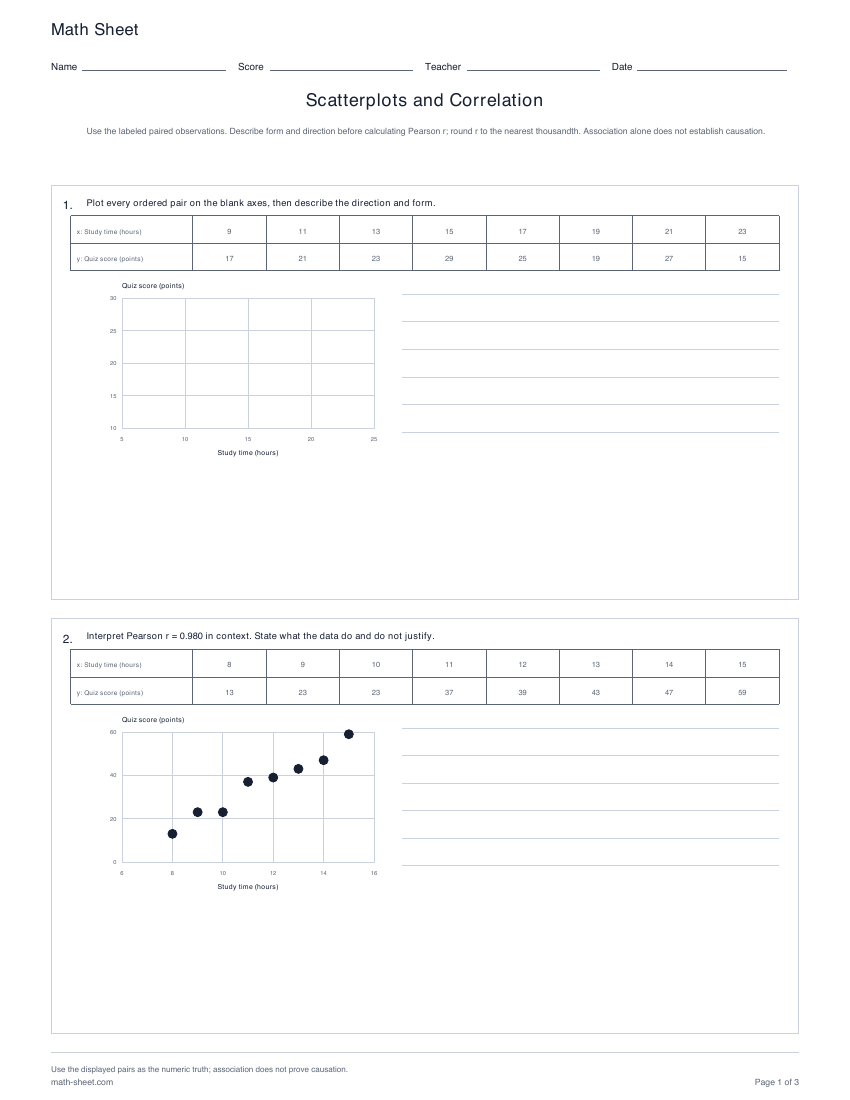
Statistics
Construct and read labeled scatterplots from actual paired observations, calculate Pearson r, and interpret linear association without claiming causation.
Preview and download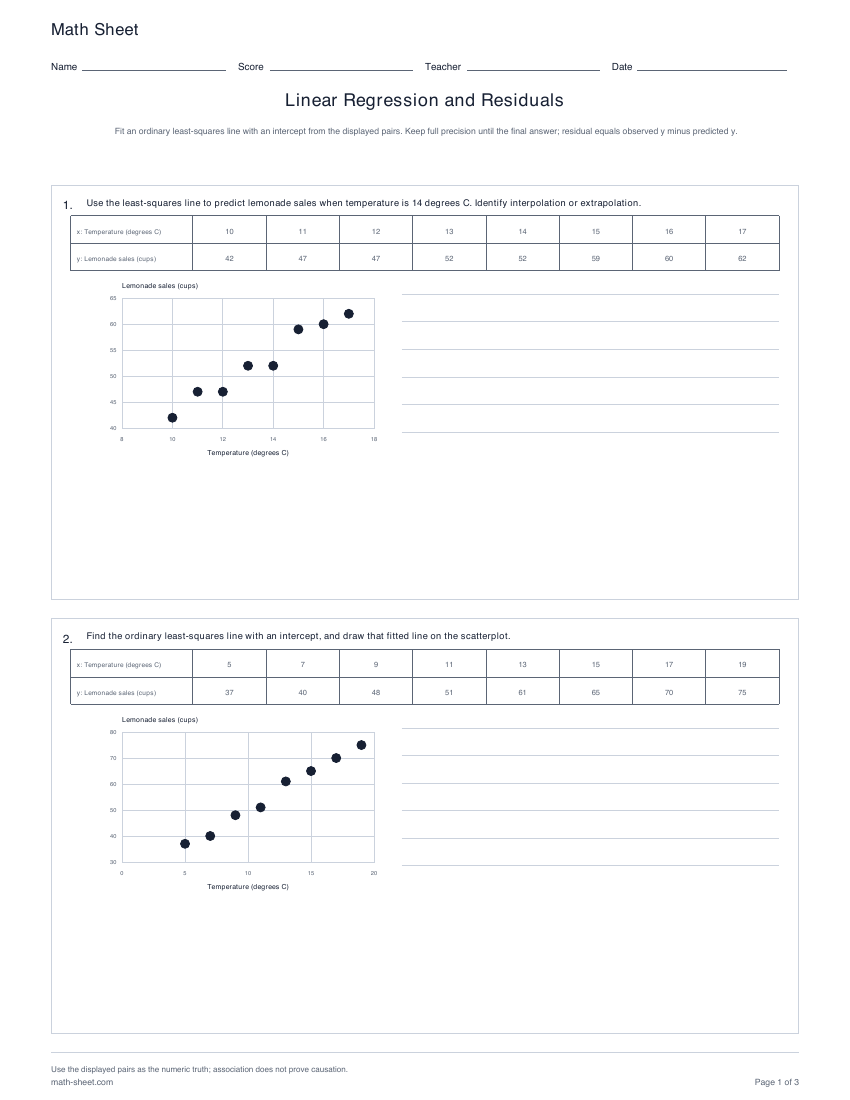
Statistics
Fit ordinary least-squares lines with intercepts, predict responses, calculate observed-minus-predicted residuals, and identify extrapolation.
Preview and download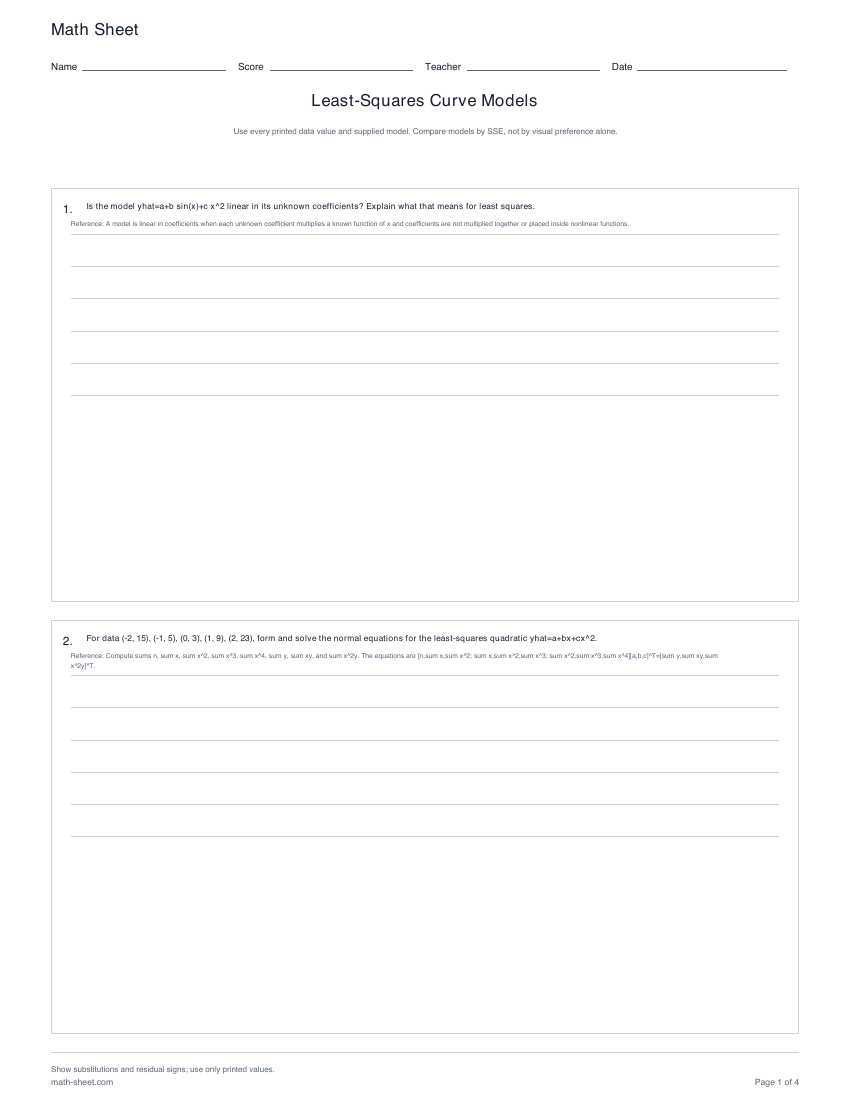
Statistics
Compare supplied line, quadratic, cubic, and transformed exponential models using residuals and SSE.
Preview and download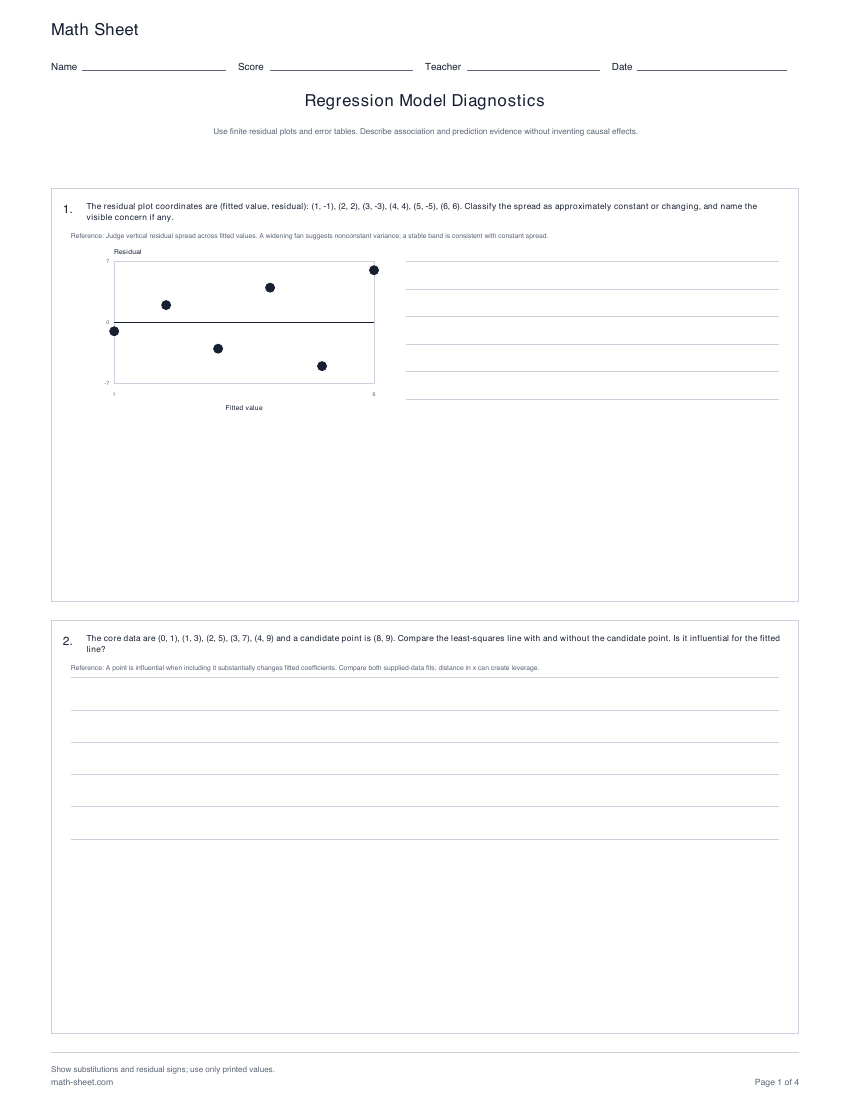
Statistics
Read finite residual plots, compare held-out errors, assess influential points, and reason about regression to the mean.
Preview and download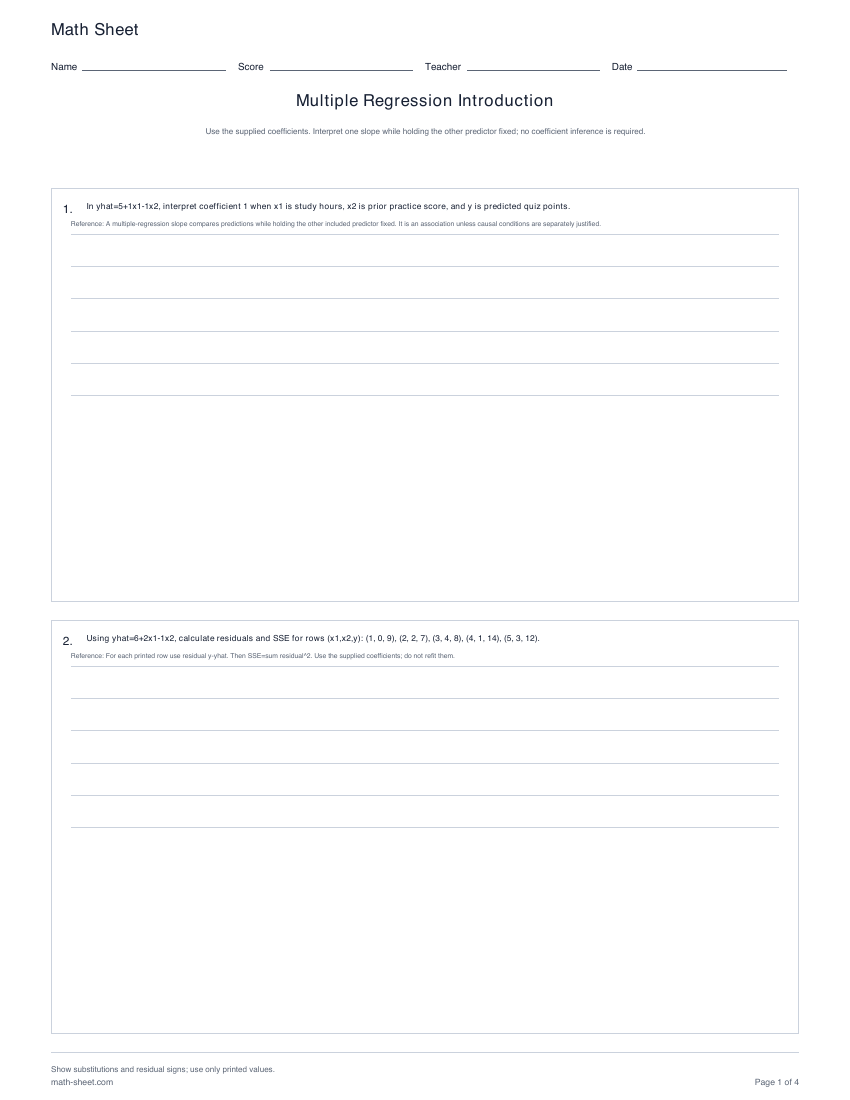
Statistics
Use a supplied two-predictor equation to identify variables, predict, calculate residuals and SSE, and write the least-squares objective.
Preview and downloadStart with complete worksheets, then remove or reorder them. Choose Letter or A4 and a student or teacher edition.
Connect density and cumulative probability with uniform, exponential and normal models. Each worksheet has its own worked answer pages.
Edit this packet →Compare binomial and Poisson counts with geometric and exponential waiting models. State the assumptions and units for each.
Edit this packet →Move from joint tables and densities to covariance, density histograms and the sampling distribution of a mean.
Edit this packet →Connect compound counting and independence with model selection, discrete CDFs and continuous transformations.
Edit this packet →Connect parameters, likelihood, discrete updates and posterior prediction.
Edit this packet →Work through continuous priors, beta and normal updates, sensitivity and credible intervals.
Edit this packet →Choose a test design, calculate evidence and interpret the conclusion across common data types.
Edit this packet →Compare normal-model, large-sample and bootstrap uncertainty calculations.
Edit this packet →Extend straight-line fitting to transformed curves, diagnostics and multiple predictors.
Edit this packet →Match the calculation to the experiment. Independence, a sampling model and a prior each express different assumptions. Label approximations, keep units visible and explain what the final number means.
These are paper mathematics exercises with worked keys. They support introductory college study; they do not replace a full course, software labs or assessment by an instructor.
Explore all probability worksheets · Explore all statistics worksheets