
Statistics
Variance and Standard Deviation worksheets
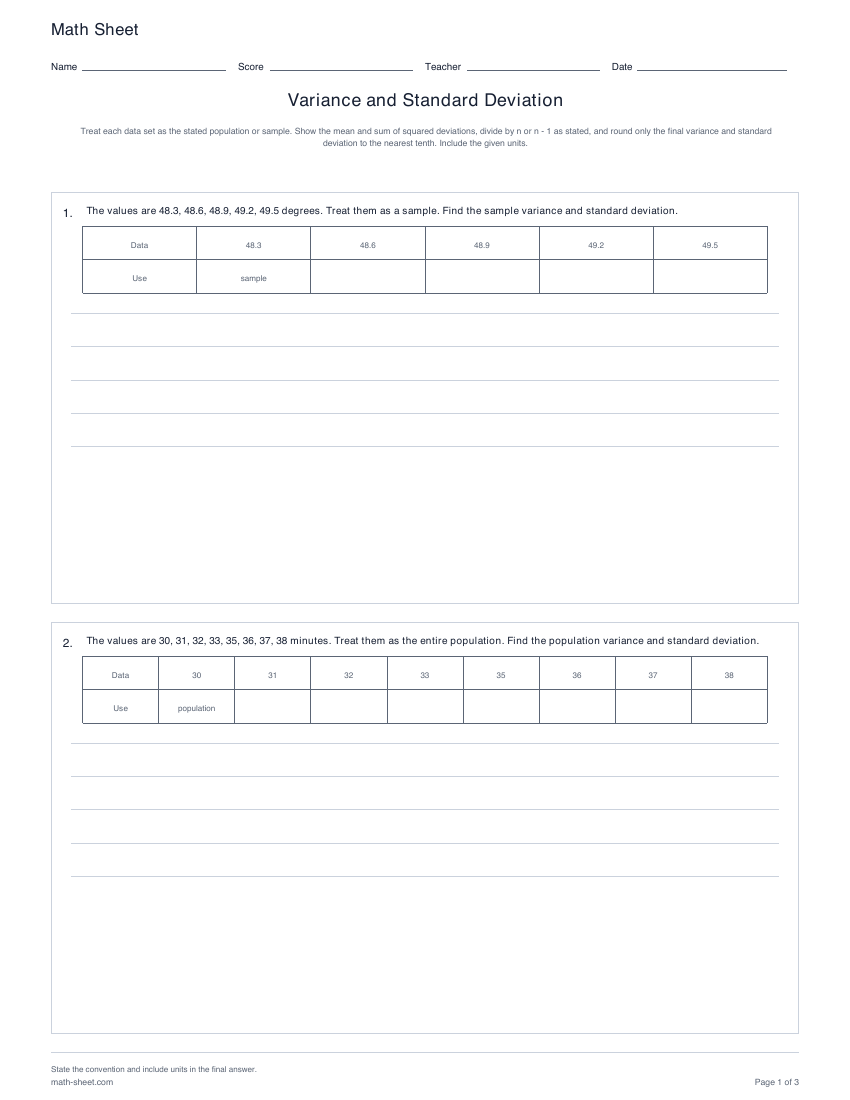
Calculate population and sample spread from small data sets with explicit n and n - 1 denominators, units, and final rounding.
Preview and downloadStatistics practice
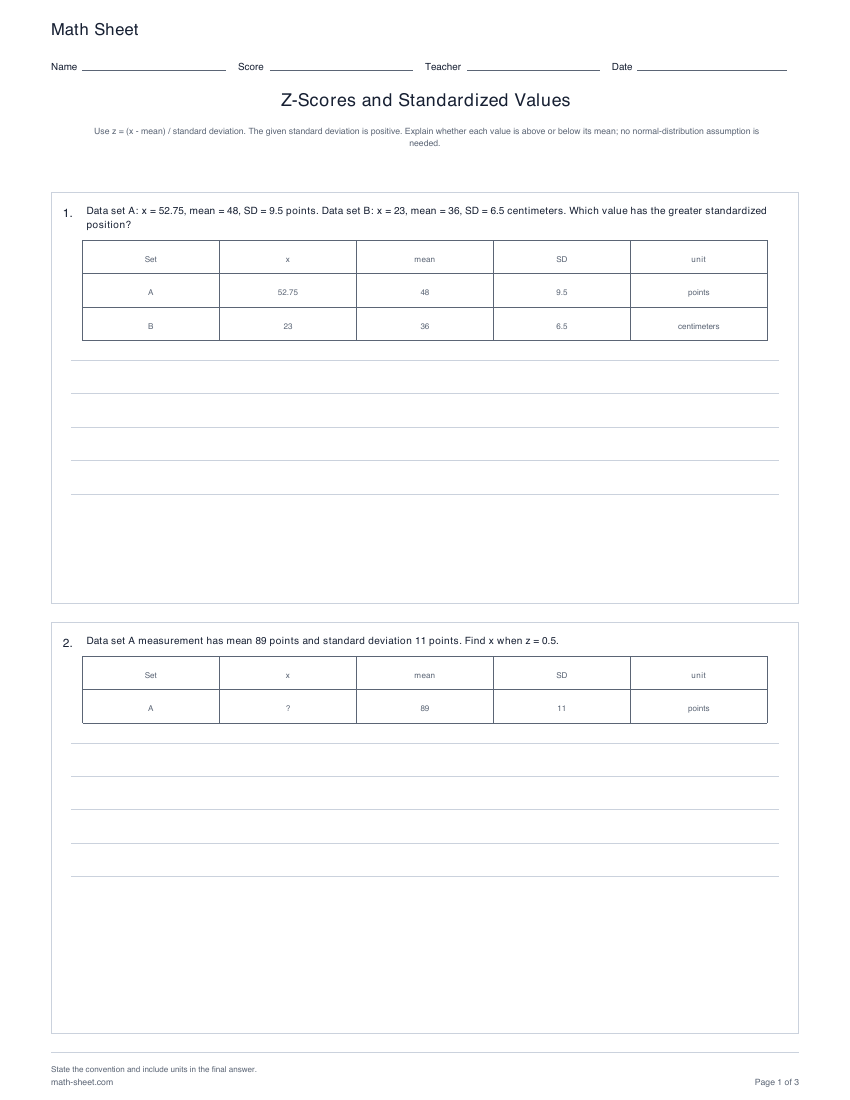
Calculate z-scores, recover original values, and compare relative positions across data sets with positive standard deviations.
Ready-made English PDF · fixed settings
Customization below makes a separate PDF.
Fixed English ready-made files. Custom settings below apply only to the configured PDF.
Ready to print
Use z = (x - mean) / standard deviation. The given standard deviation is positive. Explain whether each value is above or below its mean; no normal-distribution assumption is needed.
Download the practice pages alone, or include a separate answer key or teacher model. Longer activities may use more than one page.
Customize this worksheetVariance worksheets state whether each data set is a population or sample and show the corresponding denominator. Z-score worksheets provide the mean and a positive standard deviation, so students can focus on centered, scaled comparisons.
Learning objective
Use z = (x - mean) / standard deviation to describe and compare a value's position relative to its own data set.
Worked example
z = (74 - 68) / 3 = 2.
The value is two standard deviations above its mean. This interpretation does not require the data to be normally distributed.
Teaching notes
Make it yours
Choose your options, update the preview, then download the exact same pages.
Choose z-score calculation, value reconstruction, or standardized comparison tasks. No normal model is assumed.
A useful next step
Statistics
Calculate population and sample spread from small data sets with explicit n and n - 1 denominators, units, and final rounding.
Preview and download