
Graph
Draw single line graphs
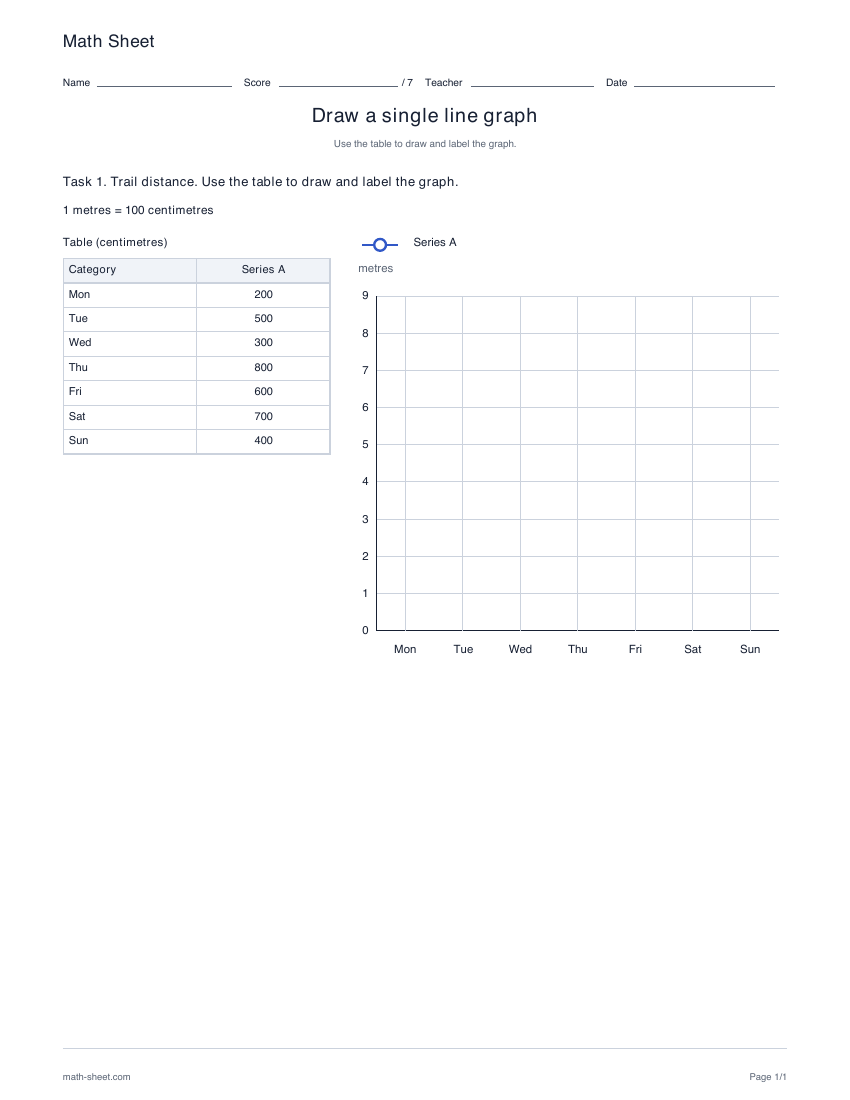
Turn a data table into a line graph. Easy practice has five categories; hard practice has seven and an explicit conversion between table and axis units.
Preview and downloadPractice by skill
Turn a table into a picture, read what a chart says, or summarize a dataset. Begin with the labels and scale, then explain how the displayed values answer the question.
Choose a graph activityData and interpretation
Connect ordered observations with a table and scale, then explain values and changes.
Graph
Turn a data table into a line graph. Easy practice has five categories; hard practice has seven and an explicit conversion between table and axis units.
Preview and download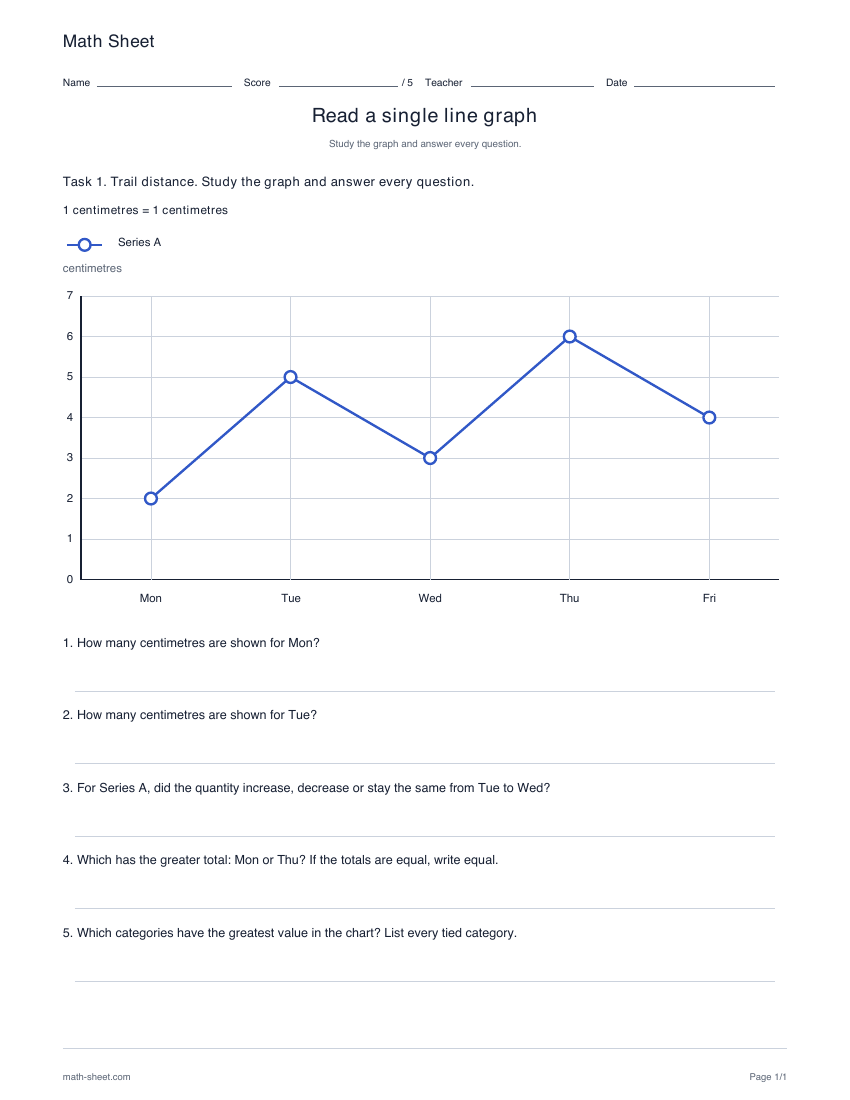
Graph
Answer five questions from a completed line graph, from reading values and changes to combining quantities and explaining comparisons.
Preview and downloadData and interpretation
Keep series identities clear while plotting, comparing or combining their values.
Graph
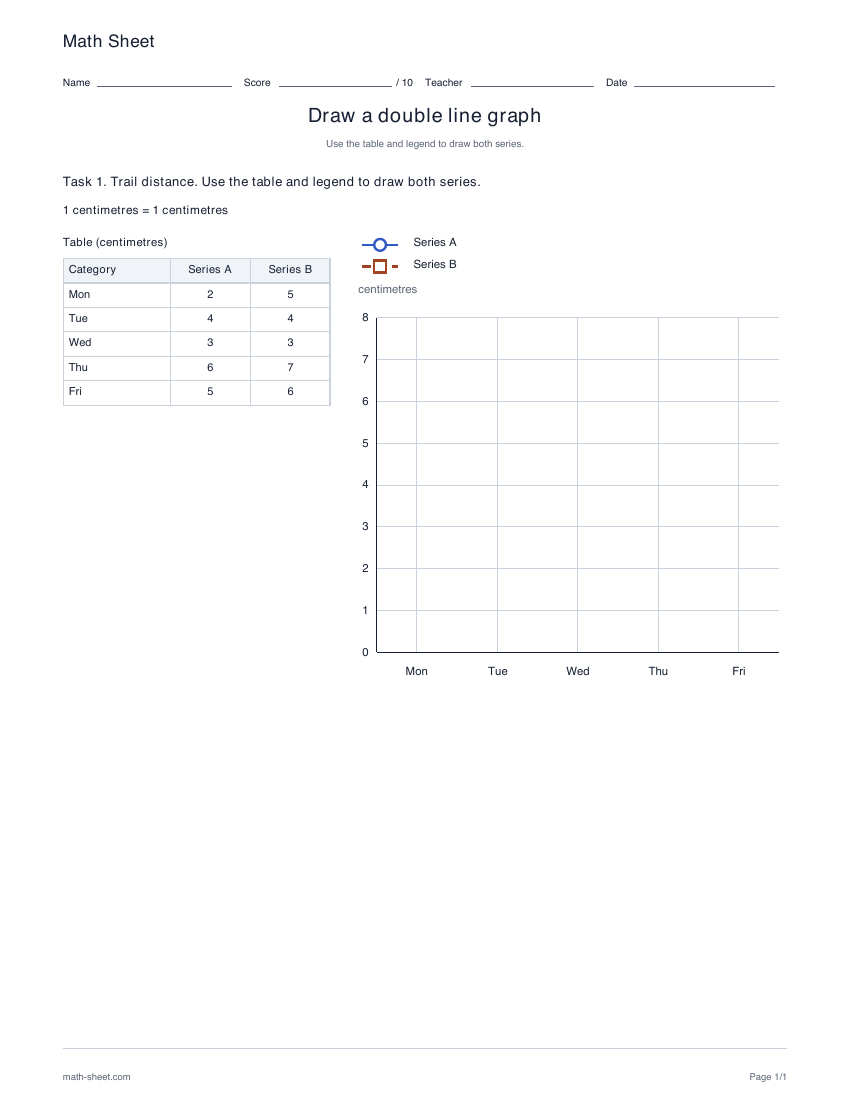
Plot two related series from one table on the same labeled grid. Use the legend to keep their points and lines distinguishable.
Preview and download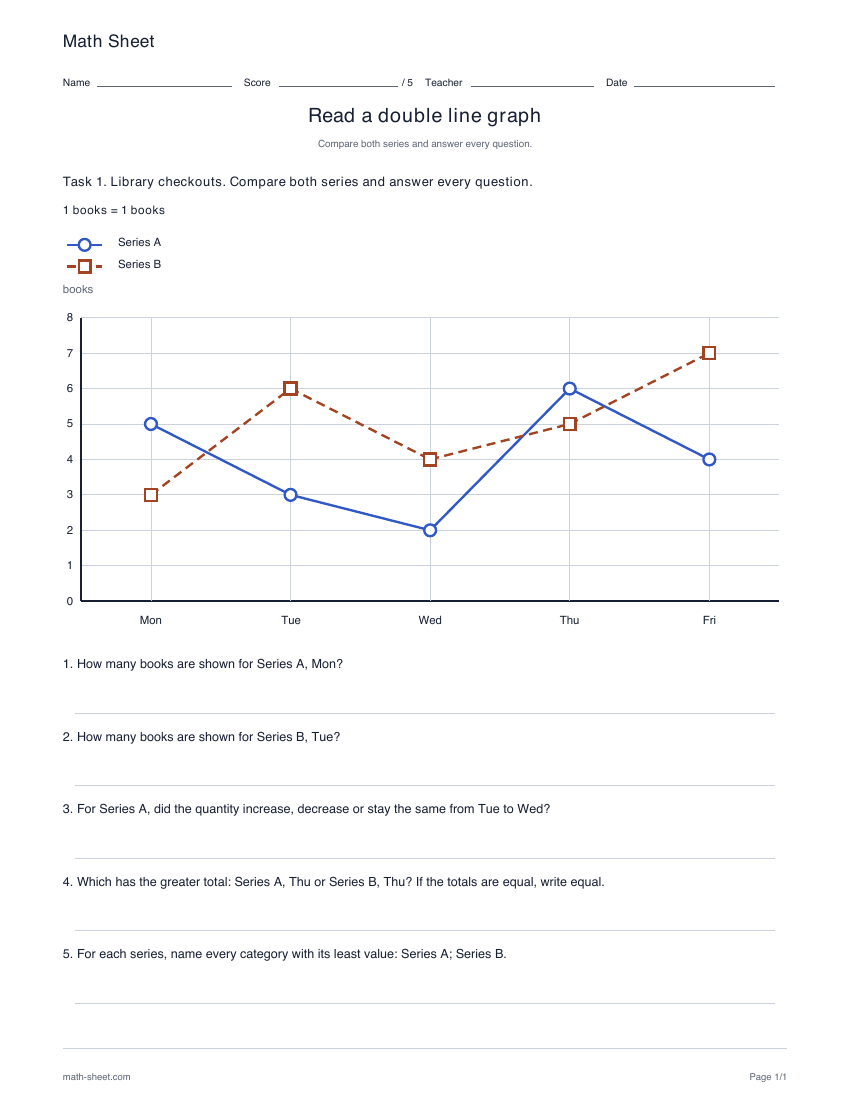
Graph
Compare two series on a shared graph and answer five questions about values, changes, totals and differences.
Preview and downloadData and interpretation
Match category values to consistent bar heights and use the stated axis units.
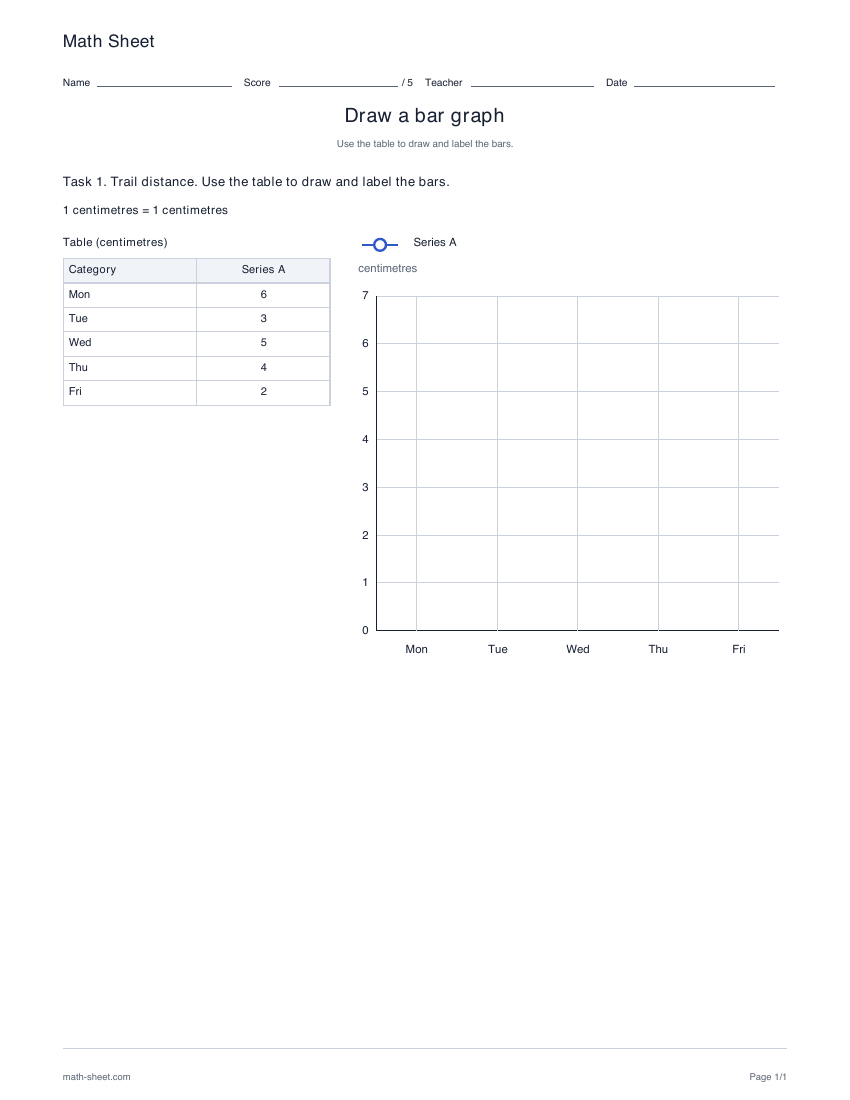
Graph
Turn a five- or seven-category table into a bar chart. Hard practice adds an explicit conversion between the table values and axis units.
Preview and download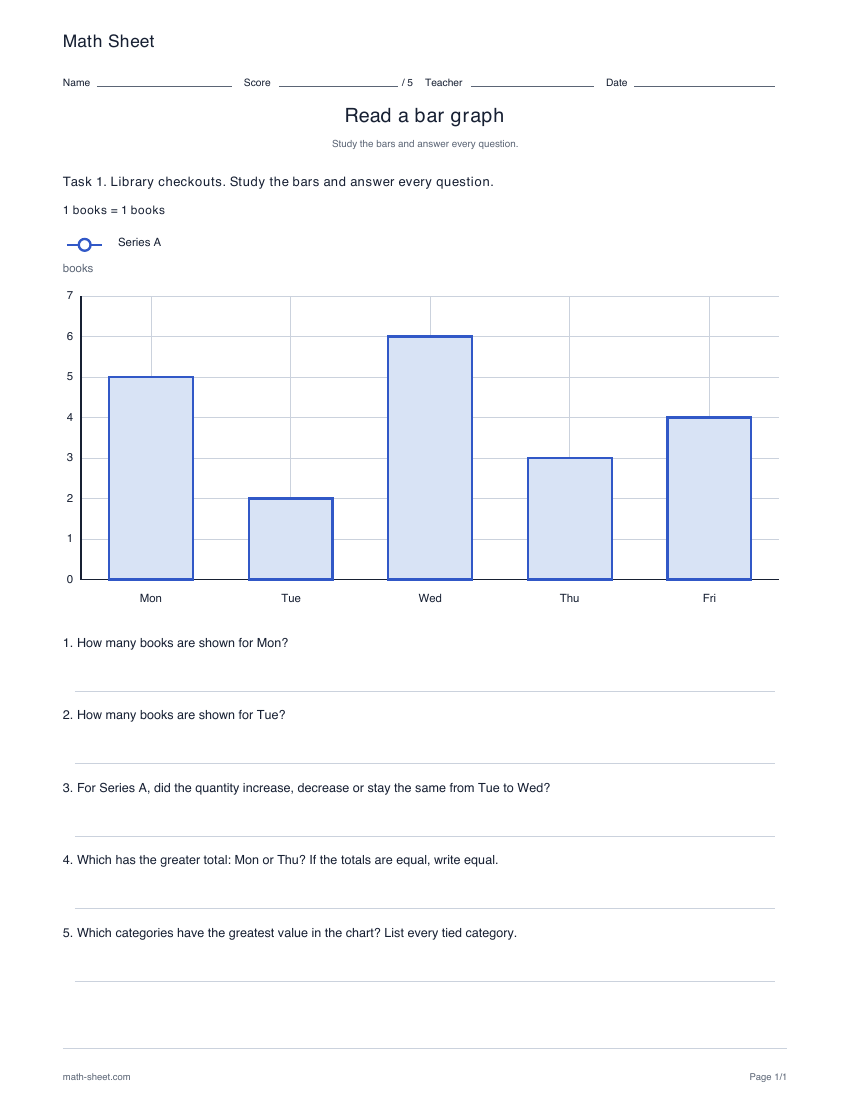
Graph
Use a completed bar chart to read values, find changes and comparisons, or calculate sums and differences in five focused questions.
Preview and downloadData and interpretation
Use percentage totals or a symbol key. Hard numerical line plots introduce frequency, probability and mean.
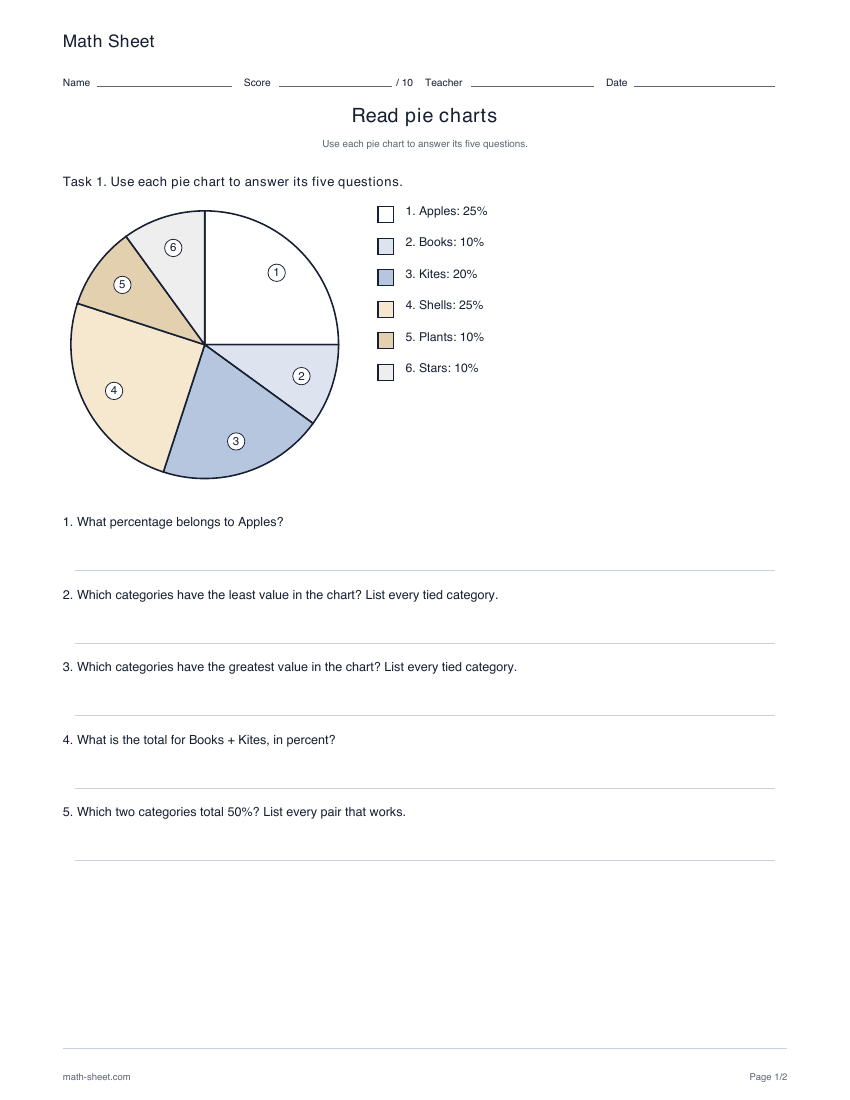
Graph
Interpret two six-category percentage distributions with five questions each. Optionally hide one recoverable share on each student chart.
Preview and download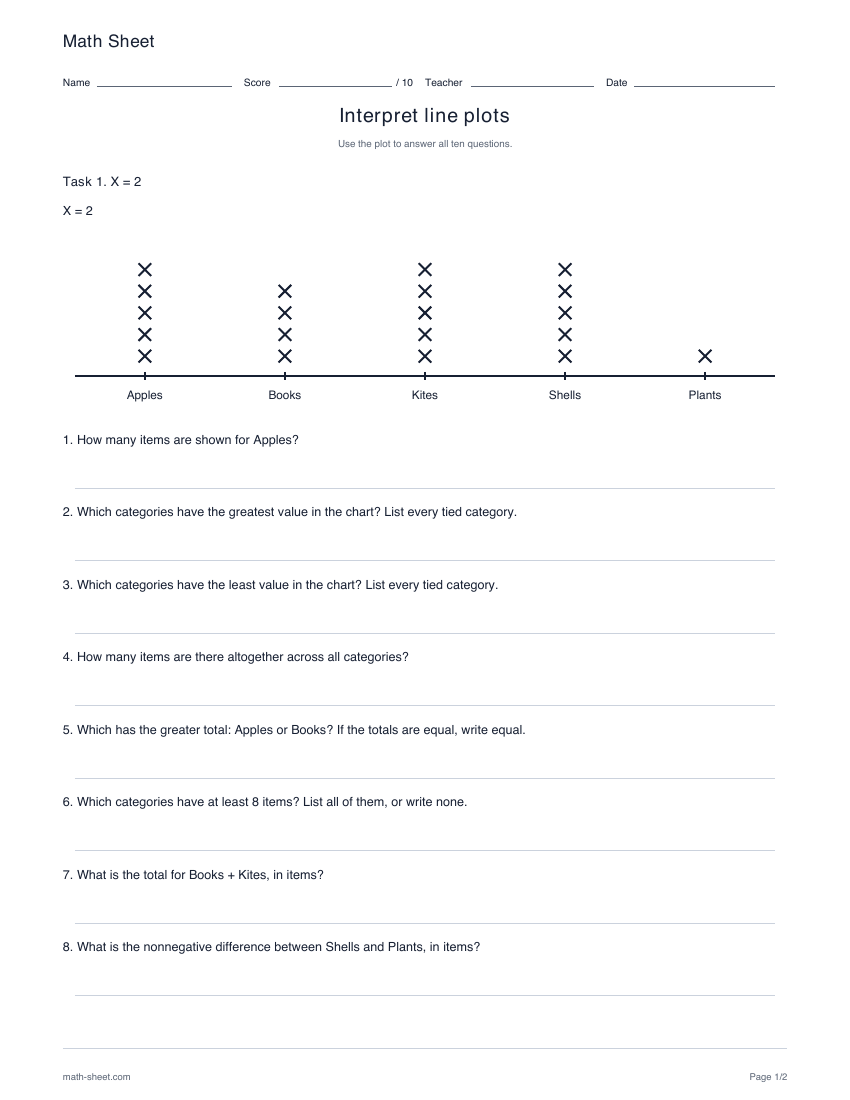
Graph
Read an easy categorical stacked-X display or a hard numerical frequency plot. Answer ten questions using the displayed key and data.
Preview and download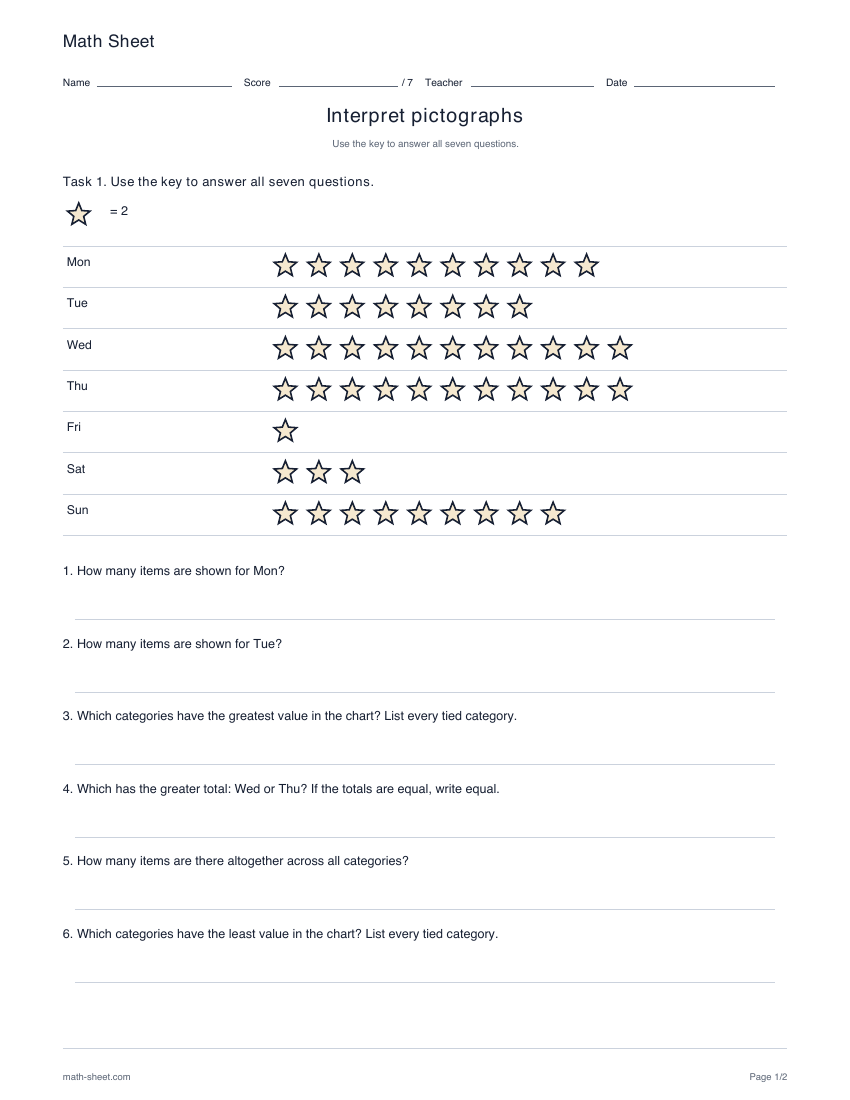
Graph
Use seven ordered categories and a whole-symbol key to answer seven questions about totals, comparisons and groups.
Preview and downloadData and interpretation
Find exact quartiles and represent the spread of observations with a box and minimum-to-maximum whiskers.
Graph
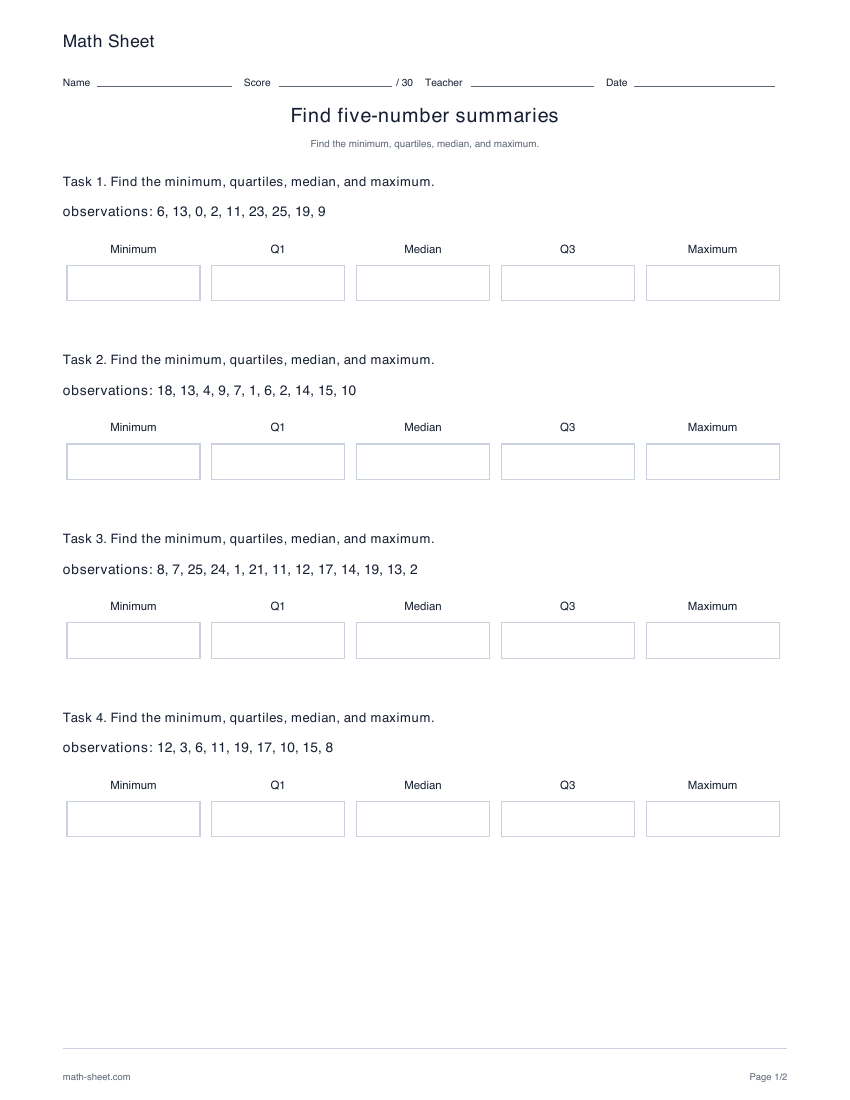
Calculate minimum, lower quartile, median, upper quartile and maximum for four or six datasets with 9–13 observations.
Preview and download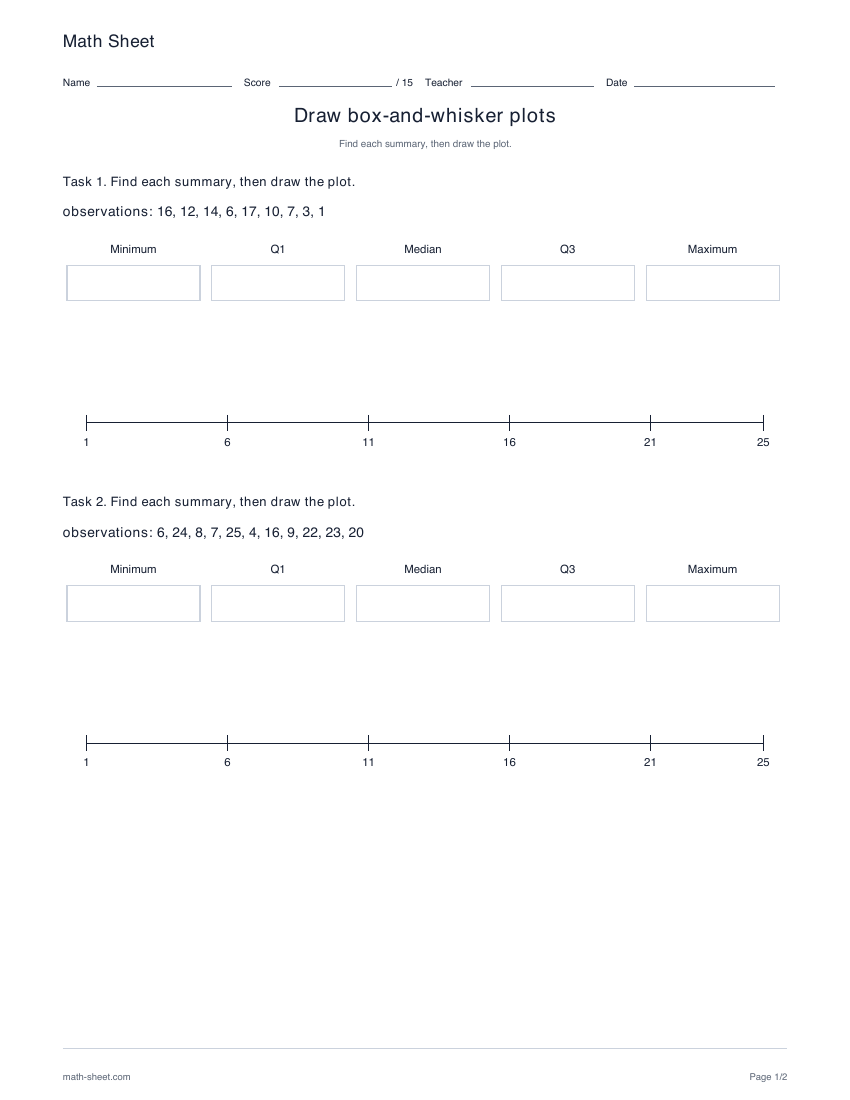
Graph
Find five-number summaries for three datasets, then draw each box plot on its labeled axis. Choose data lengths, order and number range.
Preview and download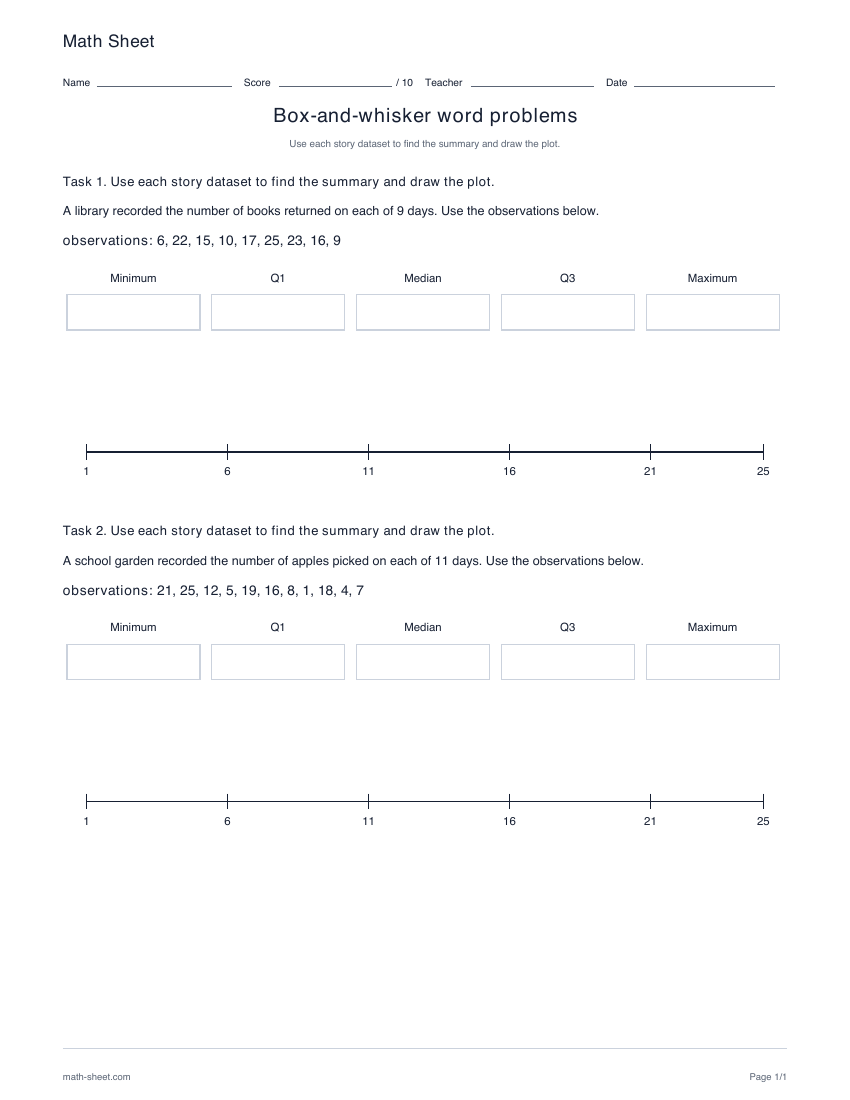
Graph
Read two original data stories, complete their five-number summaries and draw box plots on the provided axes.
Preview and downloadChoose by readiness
Easy picture and categorical X displays can support a teacher-led discussion after the learner can count the shown quantities. Read the labels together and explain what each symbol represents; one symbol need not mean one object. Begin with a few appropriate read-and-compare questions. Numerical probability plots and quartiles are later tasks.
Use only after the learner can count the displayed groups. The teacher reads category labels and explains the printed X-to-count key; do not assume X means one.
Open this supported starter →The teacher reads labels and the symbol-value key. Count in groups using that scale, and choose a few suitable read or compare questions first.
Open this supported starter →Line graphs connect ordered observations; bars compare category quantities. Pie charts describe shares of one whole. Pictographs and X displays need a key, while box plots summarize numerical observations through five values.
Read the axis or symbol key before answering. Hard drawing tasks state a conversion between table and axis units. A stack of X marks or pictures is a quantity only after applying its printed key.
Sort before calculating. For odd-length datasets, exclude the overall median from both halves; find each half’s median for Q1 and Q3. Average middle pairs exactly. Whiskers reach the observed minimum and maximum, with no separate outlier rule.
Random, ascending and descending settings change the order in which observations are presented. They do not change the sampled set or its summary. When an answer asks for all categories or pairs, include every tied result.
Study scatterplots, correlation and regression →
Practice x and y positions, signed coordinates and connected pictures in the coordinate graphing collection. Each task includes a blank grid and a separate answer graph.
Explore coordinate graphing worksheets →read · draw · explain
A graph may provide the numbers without providing the answer directly. Distinguish a read from a sum, difference, comparison or average. Keep units attached and round only when the prompt asks.