Graph practice

Interpret line plots

Read an easy categorical stacked-X display or a hard numerical frequency plot. Answer ten questions using the displayed key and data.

Ready-made English PDF · fixed settings

Customization below makes a separate PDF.

Fixed English ready-made files. Custom settings below apply only to the configured PDF.

Ready to print

Start with a ready-made worksheet

Read the key before counting X marks. In easy practice compare category totals; in hard practice each X is one observation at its numerical value.

Download the practice pages alone, or include a separate answer key or teacher model. Longer activities may use more than one page.

Customize this worksheet

Paper sizes and printing help · More graph activities

Read the scale before starting

Read the axis or symbol key before answering. Hard drawing tasks state a conversion between table and axis units. A stack of X marks or pictures is a quantity only after applying its printed key.

The static image shows the first student page. Each download includes every student page; the answer version adds the complete separate key. Some activities use multiple pages to keep charts, labels and response spaces readable.

Learning objective

What this activity builds

Distinguish a category count from a numerical value and use frequencies to answer questions.

Worked example

A numerical line plot has three X marks at 4. What do they mean?

Three observations equal 4, contributing 12 to the data sum.

The height is the frequency, three. The axis value is four; multiplying value by frequency gives its contribution to the sum.

Teaching notes

Make the practice count

  • Easy uses five named categories and an explicit X-to-count key. A teacher must explain the printed scale before using it for an early counting lesson.
  • Hard uses values 1–7 with X = 1 observation; it is a different task, not just larger category counts.
  • Hard questions include modes, cumulative counts, probability, weighted sum and mean. Round only as the prompt requests: probabilities to tenths of a percent and the mean to hundredths.
  • For less-than or greater-than comparisons, exclude observations equal to the pivot.

Make it yours

Customize the practice

Choose your options, update the preview, then download the exact same pages.

Worksheet settings

Page note and reproducible seed

The same settings and seed make the same questions. Shared links include your page note; leave personal information out. Notes use the selected language’s supported characters; English accepts basic Latin text.

Configured PDF · Interpret line plots · US Letter

Preview ready. Download includes these exact pages.

2 student pages
Enlarged pages scroll. PDF size stays the same.
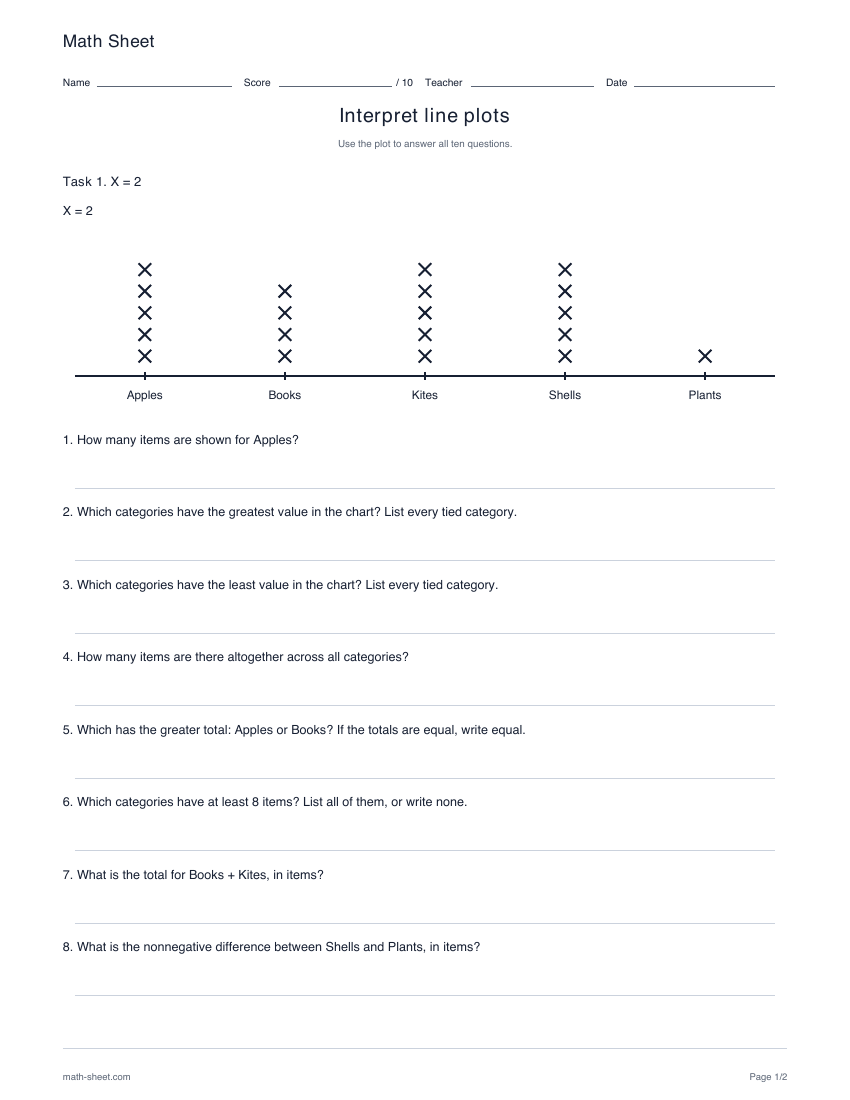
Math SheetNameScore/ 10TeacherDateInterpret line plotsUse the plot to answer all ten questions.Task 1. X = 2X = 2ApplesBooksKitesShellsPlants1. How many items are shown for Apples?2. Which categories have the greatest value in the chart? List every tied category.3. Which categories have the least value in the chart? List every tied category.4. How many items are there altogether across all categories?5. Which has the greater total: Apples or Books? If the totals are equal, write equal.6. Which categories have at least 8 items? List all of them, or write none.7. What is the total for Books + Kites, in items?8. What is the nonnegative difference between Shells and Plants, in items?math-sheet.comPage 1/2
Math SheetNameScore/ 10TeacherDateInterpret line plotsUse the plot to answer all ten questions.Task 1 (continued). X = 2X = 2ApplesBooksKitesShellsPlants9. What is the total for Apples + Plants, in items?10. Which categories have more than 6 items? List all of them, or write none.math-sheet.comPage 2/2

A useful next step

Related activities

Printable interpret pictographs worksheet preview

Graph

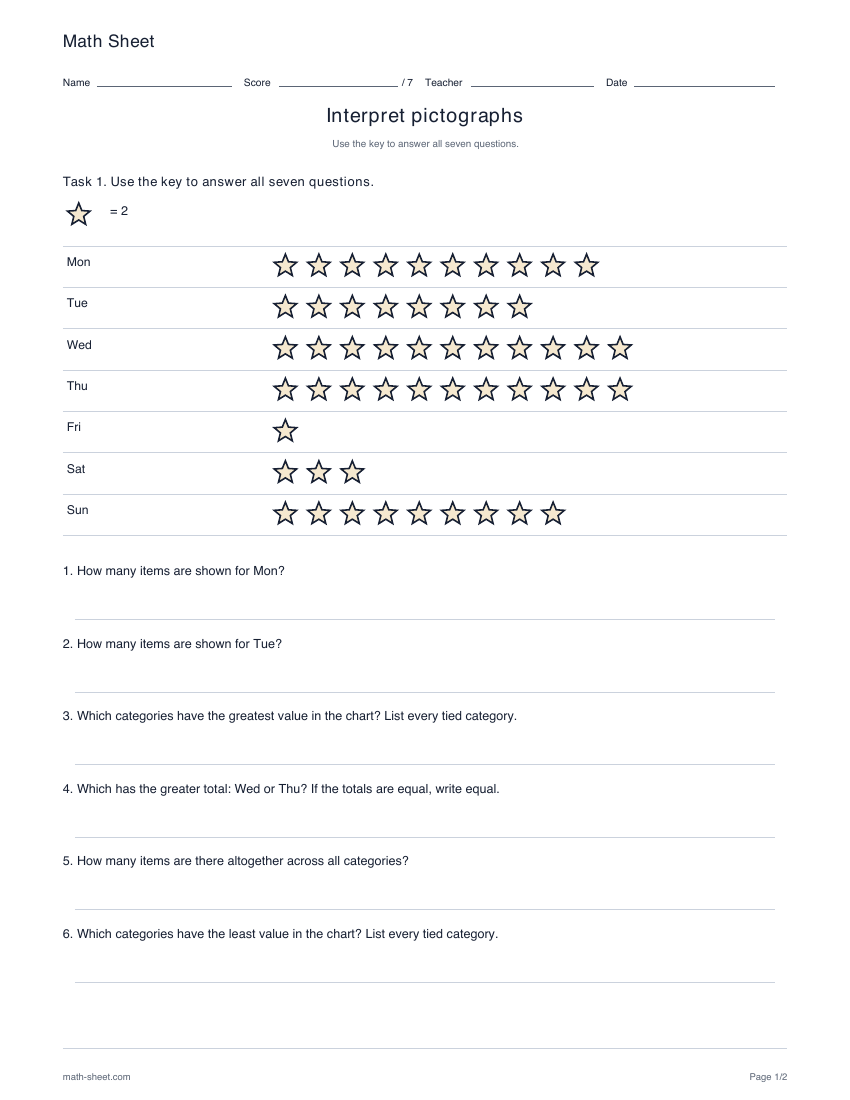
Interpret pictographs

Use seven ordered categories and a whole-symbol key to answer seven questions about totals, comparisons and groups.

Preview and download
Printable read bar graphs worksheet preview

Graph

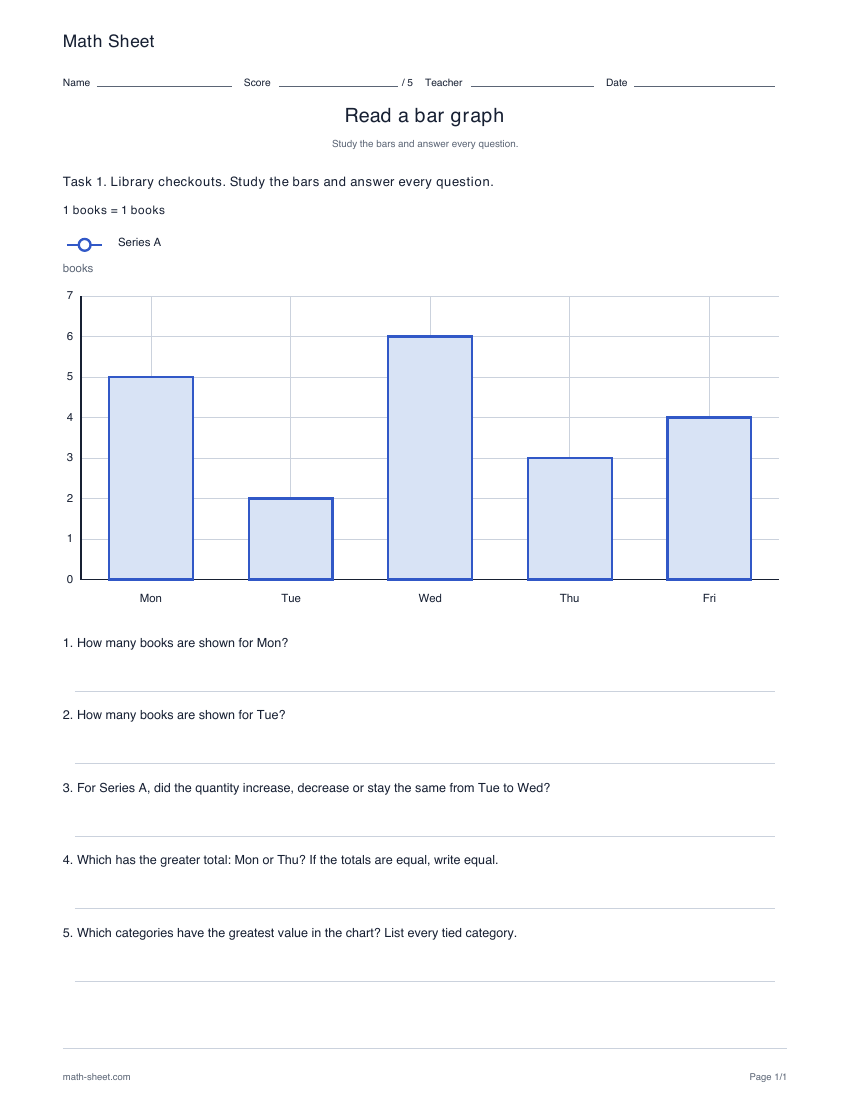
Read bar graphs

Use a completed bar chart to read values, find changes and comparisons, or calculate sums and differences in five focused questions.

Preview and download
Printable five-number summaries worksheet preview

Graph

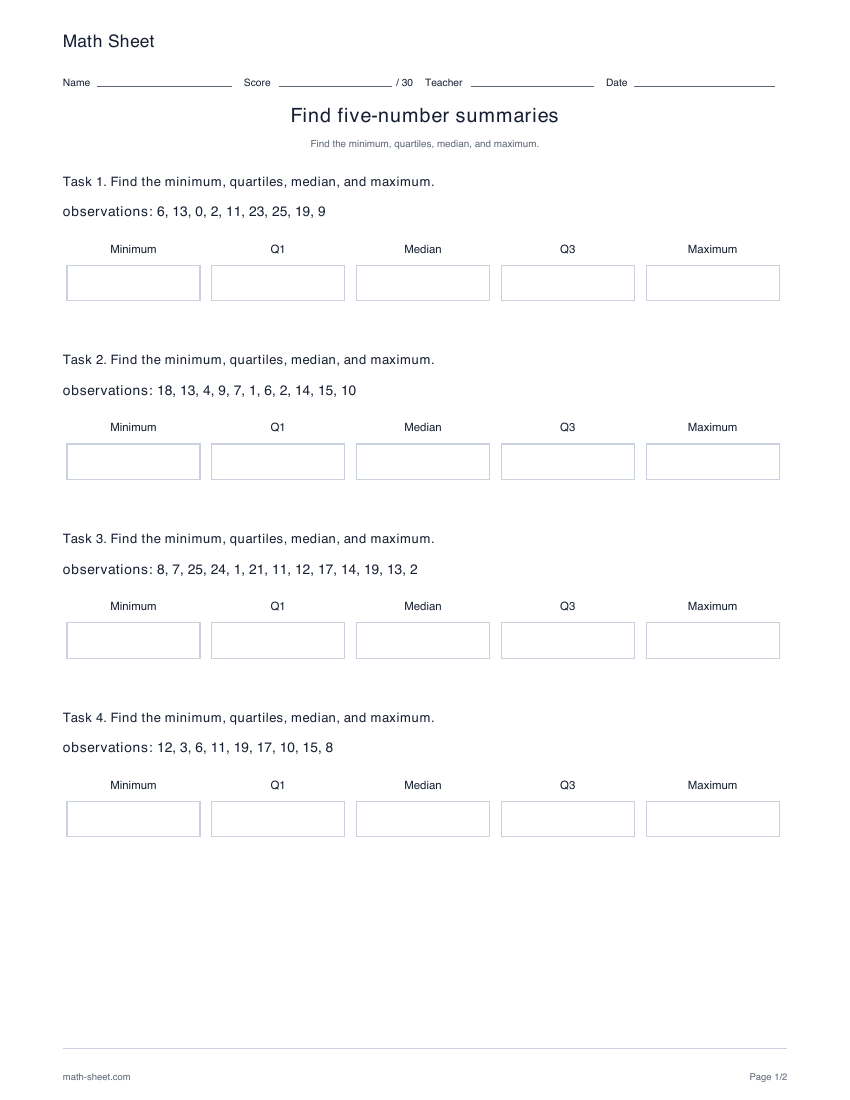
Five-number summaries

Calculate minimum, lower quartile, median, upper quartile and maximum for four or six datasets with 9–13 observations.

Preview and download