Graph practice

Five-number summaries

Calculate minimum, lower quartile, median, upper quartile and maximum for four or six datasets with 9–13 observations.

Ready-made English PDF · fixed settings

Customization below makes a separate PDF.

Fixed English ready-made files. Custom settings below apply only to the configured PDF.

Ready to print

Start with a ready-made worksheet

Order each dataset, identify the median, then find the medians of the lower and upper halves. Record all five summary values in increasing order.

Download the practice pages alone, or include a separate answer key or teacher model. Longer activities may use more than one page.

Customize this worksheet

Paper sizes and printing help · More graph activities

Use a consistent quartile convention

Sort before calculating. For odd-length datasets, exclude the overall median from both halves; find each half’s median for Q1 and Q3. Average middle pairs exactly. Whiskers reach the observed minimum and maximum, with no separate outlier rule.

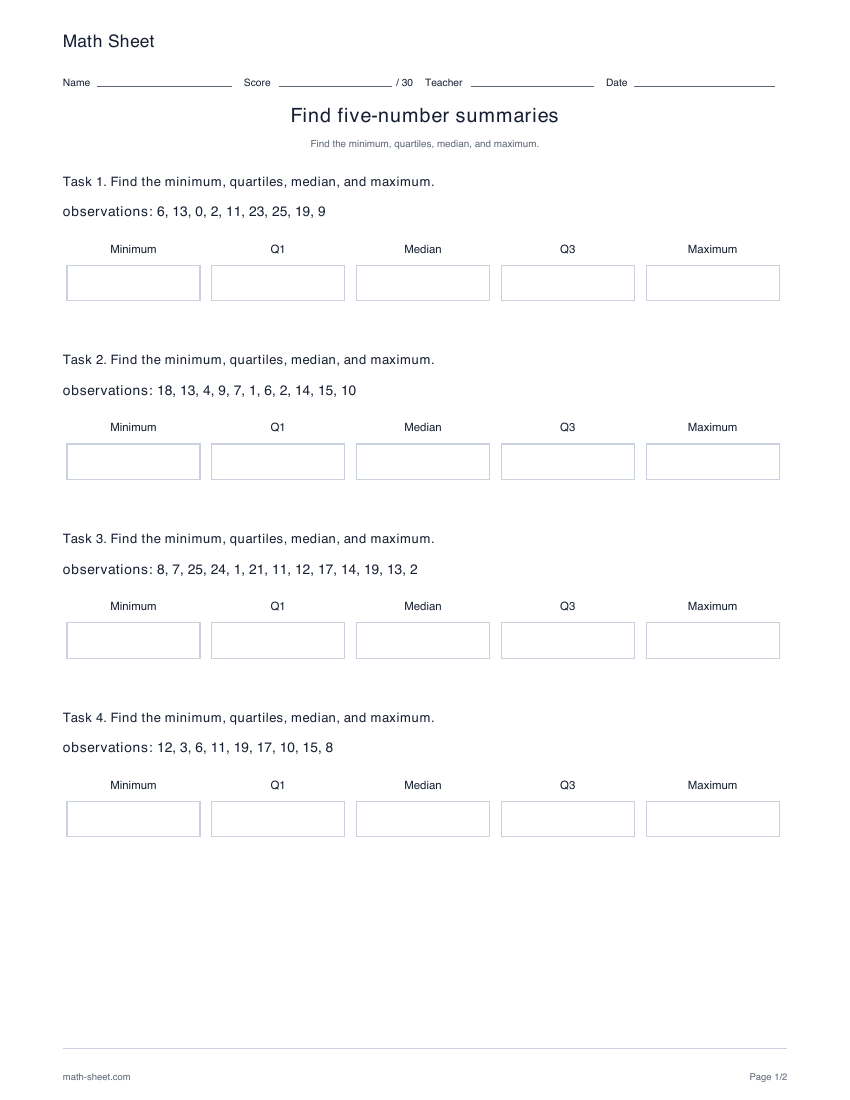
The static image shows the first student page. Each download includes every student page; the answer version adds the complete separate key. Some activities use multiple pages to keep charts, labels and response spaces readable.

Learning objective

What this activity builds

Describe the position and spread of a dataset through an exact five-number summary.

Worked example

What is the median of 2, 4, 7, 9?

5.5.

There are two middle values, 4 and 7. Their average, (4 + 7)/2, is the median even though it is not an observation.

Teaching notes

Make the practice count

  • Choose four or six datasets; this activity focuses on summary fields rather than drawing plots.
  • Ascending, descending and random settings change the presentation order, not the sampled set or its answers.
  • For odd-length data, remove the overall median before dividing the remaining observations into two halves.
  • Selected data lengths are balanced across tasks, so a short worksheet may not contain every selected length.

Make it yours

Customize the practice

Choose your options, update the preview, then download the exact same pages.

Worksheet settings

Dataset sizes
Page note and reproducible seed

The same settings and seed make the same questions. Shared links include your page note; leave personal information out. Notes use the selected language’s supported characters; English accepts basic Latin text.

Configured PDF · Find five-number summaries · US Letter

Preview ready. Download includes these exact pages.

2 student pages
Enlarged pages scroll. PDF size stays the same.
Math SheetNameScore/ 30TeacherDateFind five-number summariesFind the minimum, quartiles, median, and maximum.Task 1. Find the minimum, quartiles, median, and maximum.observations: 6, 13, 0, 2, 11, 23, 25, 19, 9MinimumQ1MedianQ3MaximumTask 2. Find the minimum, quartiles, median, and maximum.observations: 18, 13, 4, 9, 7, 1, 6, 2, 14, 15, 10MinimumQ1MedianQ3MaximumTask 3. Find the minimum, quartiles, median, and maximum.observations: 8, 7, 25, 24, 1, 21, 11, 12, 17, 14, 19, 13, 2MinimumQ1MedianQ3MaximumTask 4. Find the minimum, quartiles, median, and maximum.observations: 12, 3, 6, 11, 19, 17, 10, 15, 8MinimumQ1MedianQ3Maximummath-sheet.comPage 1/2
Math SheetNameScore/ 30TeacherDateFind five-number summariesFind the minimum, quartiles, median, and maximum.Task 5. Find the minimum, quartiles, median, and maximum.observations: 4, 22, 11, 5, 13, 18, 1, 19, 9, 7, 25MinimumQ1MedianQ3MaximumTask 6. Find the minimum, quartiles, median, and maximum.observations: 12, 0, 16, 21, 25, 5, 19, 3, 18, 22, 23, 11, 17MinimumQ1MedianQ3Maximummath-sheet.comPage 2/2

A useful next step

Related activities

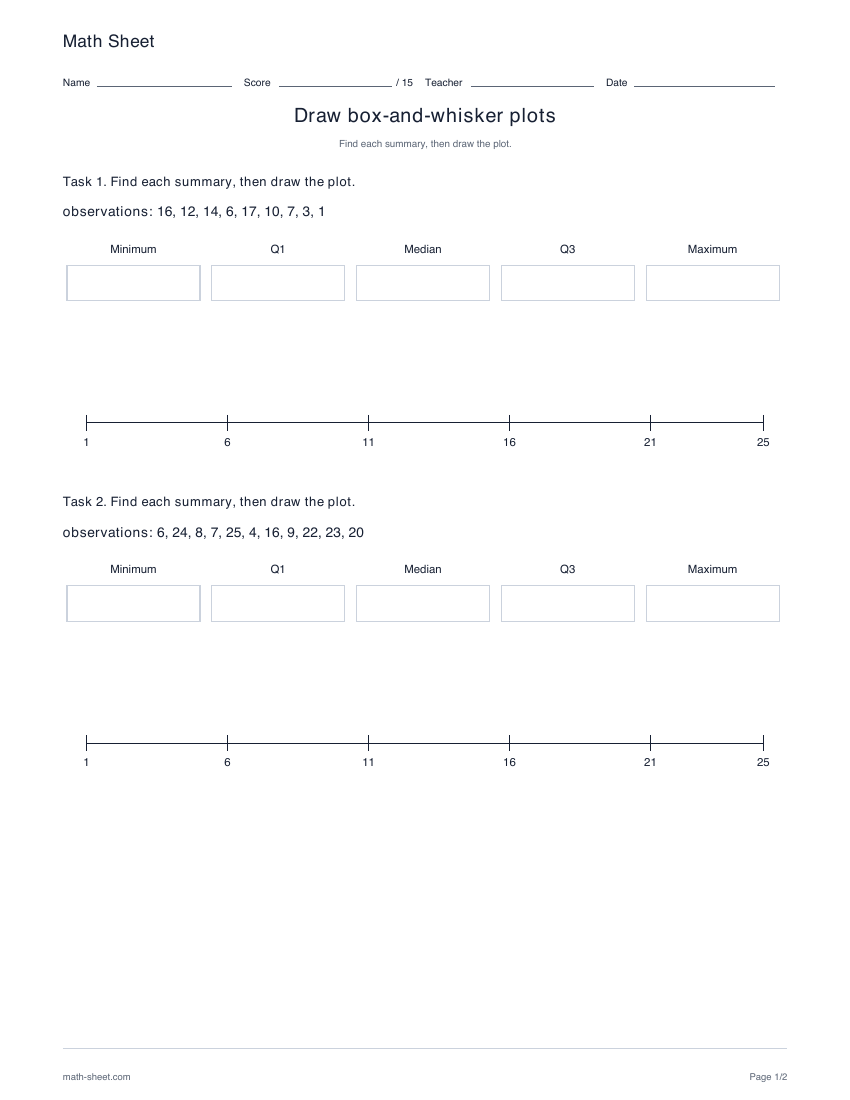
Printable draw box-and-whisker plots worksheet preview

Graph

Draw box-and-whisker plots

Find five-number summaries for three datasets, then draw each box plot on its labeled axis. Choose data lengths, order and number range.

Preview and download
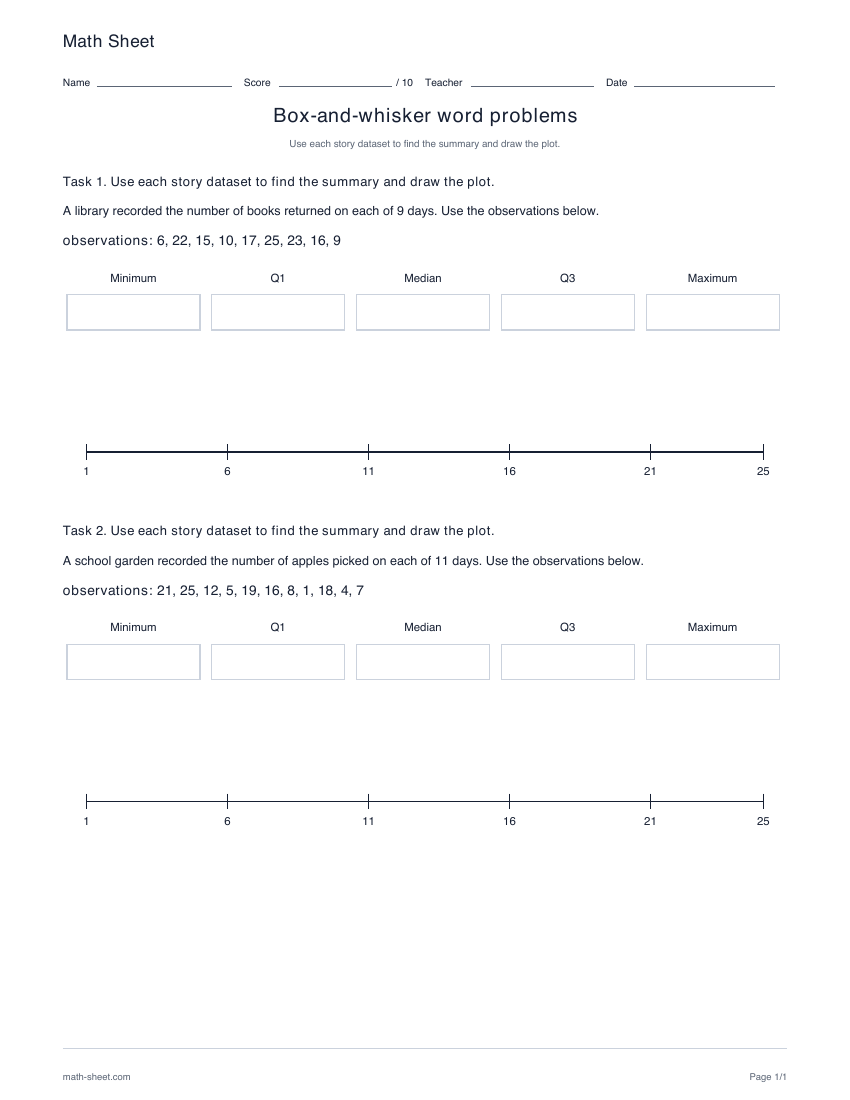
Printable box-and-whisker word problems worksheet preview

Graph

Box-and-whisker word problems

Read two original data stories, complete their five-number summaries and draw box plots on the provided axes.

Preview and download
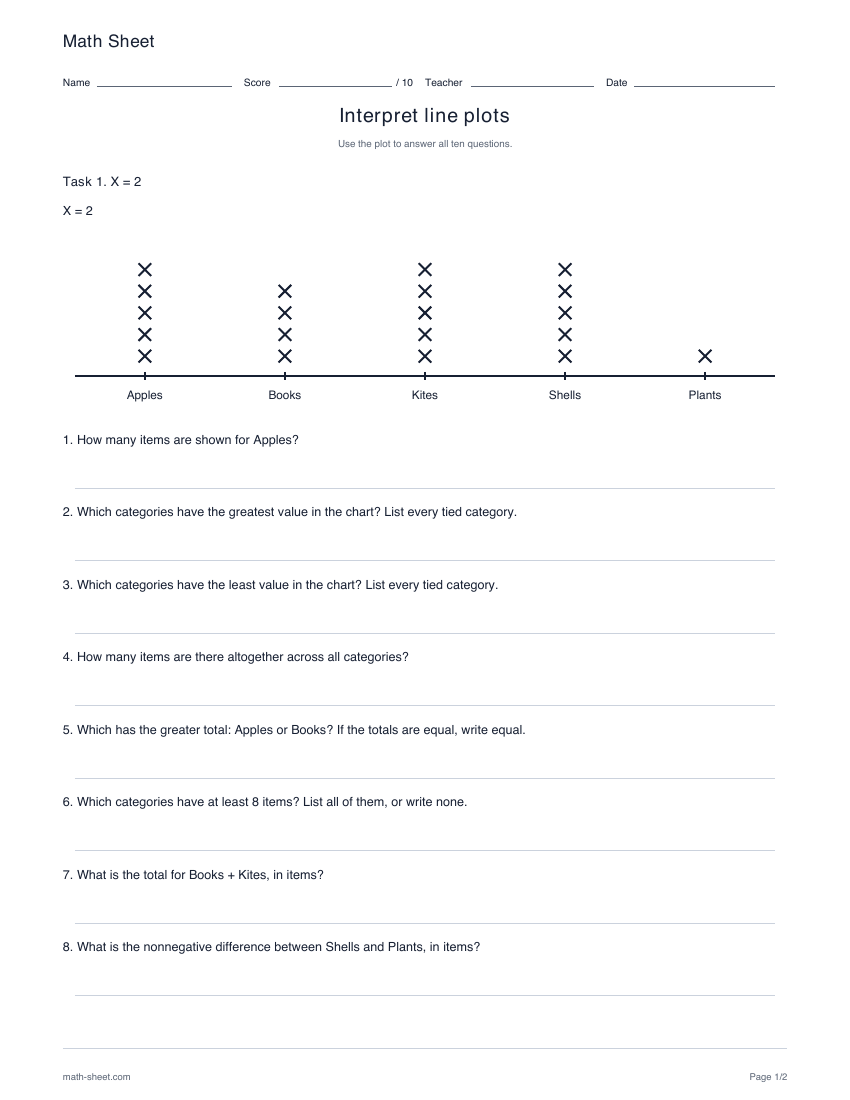
Printable interpret line plots worksheet preview

Graph

Interpret line plots

Read an easy categorical stacked-X display or a hard numerical frequency plot. Answer ten questions using the displayed key and data.

Preview and download