Statistics practice

Variance and Standard Deviation worksheets

Calculate population and sample spread from small data sets with explicit n and n - 1 denominators, units, and final rounding.

Ready-made English PDF · fixed settings

Customization below makes a separate PDF.

Fixed English ready-made files. Custom settings below apply only to the configured PDF.

Ready to print

Start with a ready-made worksheet

Treat each data set as the stated population or sample. Show the mean and sum of squared deviations, divide by n or n - 1 as stated, and round only the final variance and standard deviation to the nearest tenth. Include the given units.

Download the practice pages alone, or include a separate answer key or teacher model. Longer activities may use more than one page.

Customize this worksheet

Paper sizes and printing help · More statistics activities

Keep the convention visible

Variance worksheets state whether each data set is a population or sample and show the corresponding denominator. Z-score worksheets provide the mean and a positive standard deviation, so students can focus on centered, scaled comparisons.

Learning objective

What this activity builds

Find the mean, sum of squared deviations, variance, and standard deviation while applying the stated population or sample convention.

Worked example

Treat 2, 4, 6 as a population. Find the population variance and standard deviation.

Mean = 4; sum of squared deviations = 8; variance = 8/3, approximately 2.7; standard deviation is approximately 1.6.

Population variance divides by n = 3. The standard deviation returns to the original data units.

Teaching notes

Make the practice count

  • Have students label the data as a population or sample before calculating.
  • Keep the sum of squared deviations unrounded until the final variance and standard deviation.
  • Discuss why variance uses squared units while standard deviation uses the original units.

Make it yours

Customize the practice

Choose your options, update the preview, then download the exact same pages.

Choose population, sample, or both; select data set sizes and integer or tenths values. Keep the seed to reproduce the same worksheet.

Worksheet settings

Data convention
Data set sizes
Page note and reproducible seed

The same settings and seed make the same questions. Shared links include your page note; leave personal information out.

Configured PDF · Variance and Standard Deviation · US Letter

Preview ready. Download includes these exact pages.

3 student pages
Enlarged pages scroll. PDF size stays the same.
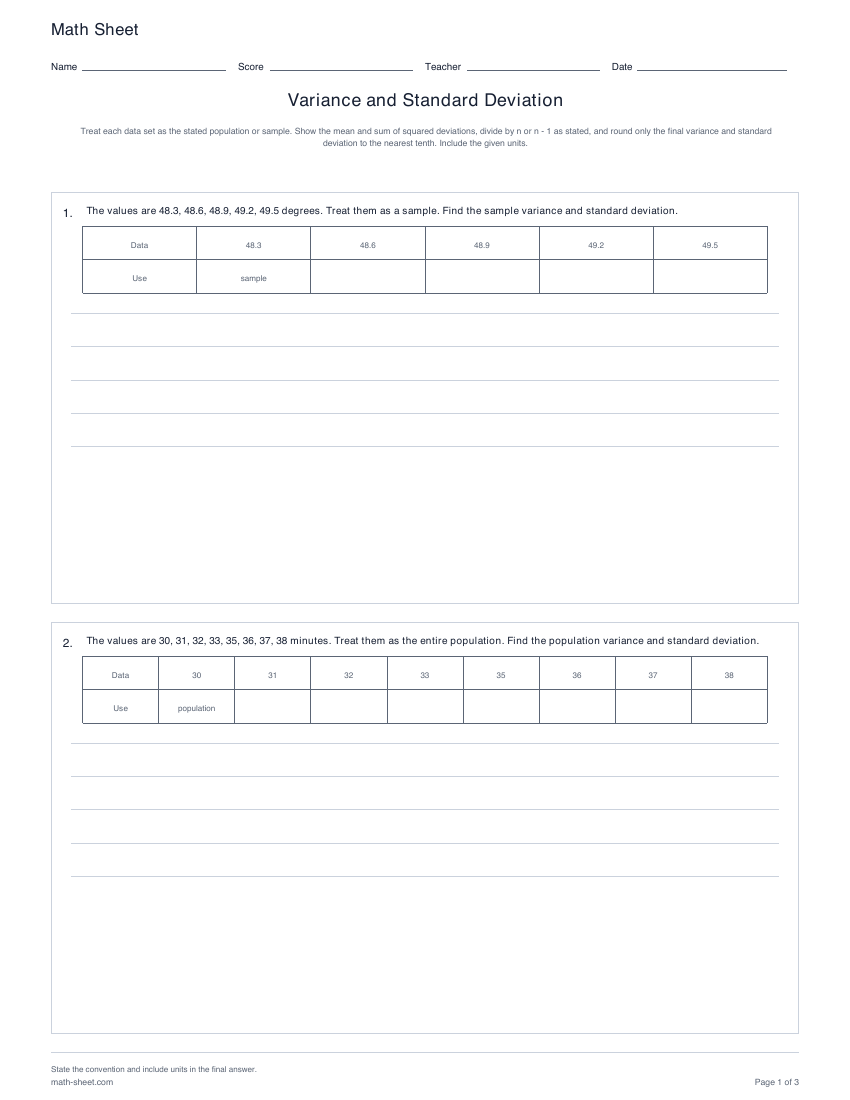
Math SheetNameScoreTeacherDateVariance and Standard DeviationTreat each data set as the stated population or sample. Show the mean and sum of squared deviations, divide by n or n - 1 as stated, and round only the final variance and standarddeviation to the nearest tenth. Include the given units.1.The values are 48.3, 48.6, 48.9, 49.2, 49.5 degrees. Treat them as a sample. Find the sample variance and standard deviation.Data48.348.648.949.249.5Usesample2.The values are 30, 31, 32, 33, 35, 36, 37, 38 minutes. Treat them as the entire population. Find the population variance and standard deviation.Data3031323335363738UsepopulationState the convention and include units in the final answer.math-sheet.comPage 1 of 3
Math SheetNameScoreTeacherDateVariance and Standard DeviationTreat each data set as the stated population or sample. Show the mean and sum of squared deviations, divide by n or n - 1 as stated, and round only the final variance and standarddeviation to the nearest tenth. Include the given units.3.The values are 66, 68, 70, 72, 74, 78, 80, 82, 84, 86 points. Treat them as a sample. Find the sample variance and standard deviation.Data66687072747880828486Usesample4.The values are 16.1, 16.5, 16.9, 17.3, 18.1, 18.5, 18.9, 19.3 degrees. Treat them as the entire population. Find the population variance and standarddeviation.Data16.116.516.917.318.118.518.919.3UsepopulationState the convention and include units in the final answer.math-sheet.comPage 2 of 3
Math SheetNameScoreTeacherDateVariance and Standard DeviationTreat each data set as the stated population or sample. Show the mean and sum of squared deviations, divide by n or n - 1 as stated, and round only the final variance and standarddeviation to the nearest tenth. Include the given units.5.The values are 69.5, 69.7, 69.9, 70.1, 70.3, 70.7, 70.9, 71.1, 71.3, 71.5 minutes. Treat them as the entire population. Find the population variance andstandard deviation.Data69.569.769.970.170.370.770.971.171.371.5Usepopulation6.The values are 49, 51, 53, 55, 57 minutes. Treat them as a sample. Find the sample variance and standard deviation.Data4951535557UsesampleState the convention and include units in the final answer.math-sheet.comPage 3 of 3

A useful next step

Related activities

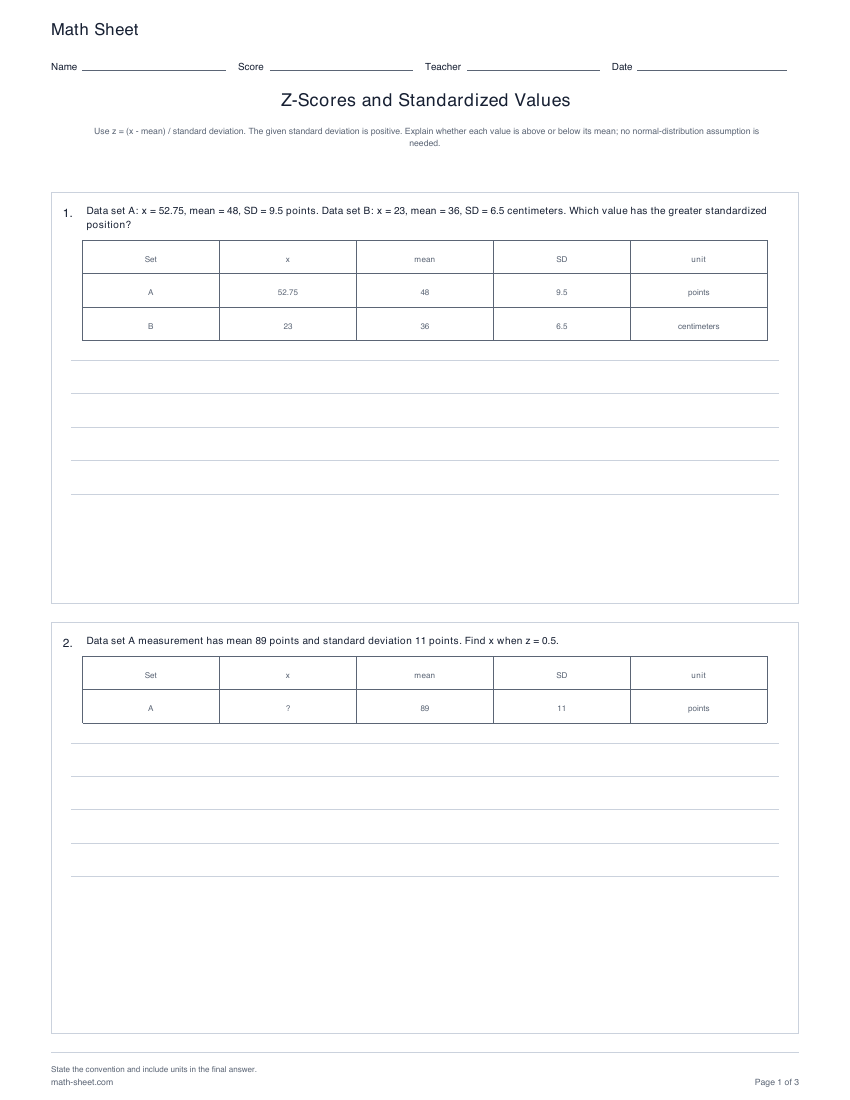
Printable z-scores worksheets preview

Statistics

Z-Scores worksheets

Calculate z-scores, recover original values, and compare relative positions across data sets with positive standard deviations.

Preview and download