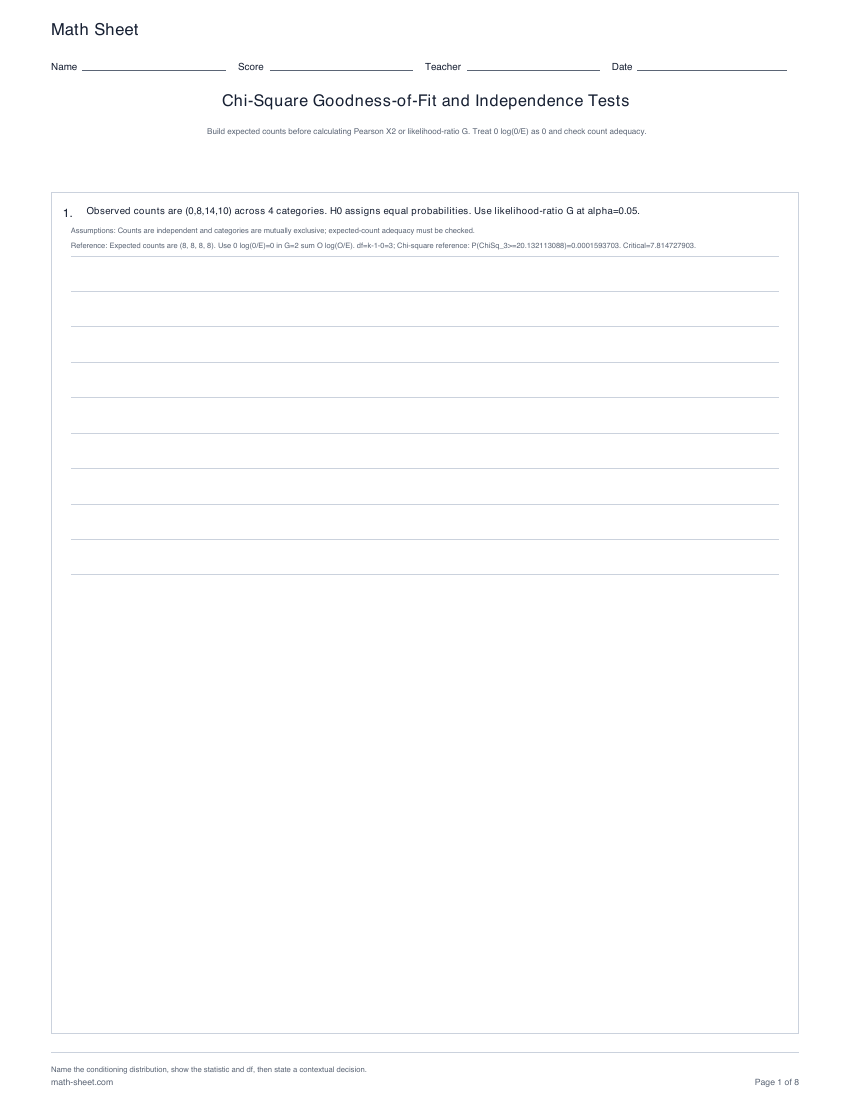
Math Sheet Name Score Teacher Date Chi-Square Goodness-of-Fit and Independence Tests Build expected counts before calculating Pearson X2 or likelihood-ratio G. Treat 0 log(0/E) as 0 and check count adequacy. 1. Observed counts are (0,8,14,10) across 4 categories. H0 assigns equal probabilities. Use likelihood-ratio G at alpha=0.05. Assumptions: Counts are independent and categories are mutually exclusive; expected-count adequacy must be checked. Reference: Expected counts are (8, 8, 8, 8). Use 0 log(0/E)=0 in G=2 sum O log(O/E). df=k-1-0=3; Chi-square reference: P(ChiSq_3>=20.132113088)=0.0001593703. Critical=7.814727903. Name the conditioning distribution, show the statistic and df, then state a contextual decision. math-sheet.com Page 1 of 8
Math Sheet Name Score Teacher Date Chi-Square Goodness-of-Fit and Independence Tests Build expected counts before calculating Pearson X2 or likelihood-ratio G. Treat 0 log(0/E) as 0 and check count adequacy. 2. Observed 2x3 table rows are [13,18,10] and [20,15,16]. Test independence using likelihood-ratio G at alpha=0.1. Assumptions: Observations are independent counts; categories are mutually exclusive; verify expected counts. Reference: Expected E_ij=(row total)(column total)/N. G=2 sum O log(O/E), with 0 log(0/E)=0. df=(r-1)(c-1)=2; Chi-square reference: P(ChiSq_2>=2.077360604)=0.3539214433. Critical=4.605170186. Name the conditioning distribution, show the statistic and df, then state a contextual decision. math-sheet.com Page 2 of 8
Math Sheet Name Score Teacher Date Chi-Square Goodness-of-Fit and Independence Tests Build expected counts before calculating Pearson X2 or likelihood-ratio G. Treat 0 log(0/E) as 0 and check count adequacy. 3. Observed 2x2 table rows are [17,10] and [8,19]. Test independence using Pearson X2 at alpha=0.01. Assumptions: Observations are independent counts; categories are mutually exclusive; verify expected counts. Reference: Expected E_ij=(row total)(column total)/N. X2=sum (O-E)^2/E. df=(r-1)(c-1)=1; Chi-square reference: P(ChiSq_1>=6.033103448)=0.0140400271. Critical=6.634896601. Name the conditioning distribution, show the statistic and df, then state a contextual decision. math-sheet.com Page 3 of 8
Math Sheet Name Score Teacher Date Chi-Square Goodness-of-Fit and Independence Tests Build expected counts before calculating Pearson X2 or likelihood-ratio G. Treat 0 log(0/E) as 0 and check count adequacy. 4. Observed counts are (8,11,14) across 3 categories. H0 assigns equal probabilities. Use Pearson X2 at alpha=0.05. Assumptions: Counts are independent and categories are mutually exclusive; expected-count adequacy must be checked. Reference: Expected counts are (11, 11, 11). Use X2=sum (O-E)^2/E. df=k-1-0=2; Chi-square reference: P(ChiSq_2>=1.636363636)=0.4412331678. Critical=5.991464547. Name the conditioning distribution, show the statistic and df, then state a contextual decision. math-sheet.com Page 4 of 8
Math Sheet Name Score Teacher Date Chi-Square Goodness-of-Fit and Independence Tests Build expected counts before calculating Pearson X2 or likelihood-ratio G. Treat 0 log(0/E) as 0 and check count adequacy. 5. Observed counts are (2,5,6) across 3 categories. H0 assigns equal probabilities. Use Pearson X2 at alpha=0.1 and decide whether the chi-square approximation is adequate. Assumptions: Counts are independent and categories are mutually exclusive; expected-count adequacy must be checked. Reference: Expected counts are (4.333, 4.333, 4.333). Use X2=sum (O-E)^2/E. df=k-1-0=2; Chi-square reference: P(ChiSq_2>=2.000000000)=0.3678794412. Critical=4.605170186. Name the conditioning distribution, show the statistic and df, then state a contextual decision. math-sheet.com Page 5 of 8
Math Sheet Name Score Teacher Date Chi-Square Goodness-of-Fit and Independence Tests Build expected counts before calculating Pearson X2 or likelihood-ratio G. Treat 0 log(0/E) as 0 and check count adequacy. 6. Observed counts are (6,9,9,9,12) across 5 categories. H0 has P(C1)=...=P(C4)=p and P(C5)=1-4p; estimate p from these data. Use Pearson X2 at alpha=0.01. Assumptions: Counts are independent and categories are mutually exclusive; expected-count adequacy must be checked. Reference: Expected counts are (8.25, 8.25, 8.25, 8.25, 12). The MLE is p-hat=sum of the first 4 counts/[4N]=0.183333333. Use X2=sum (O-E)^2/E. df=k-1-1=3; Chi-square reference: P(ChiSq_3>=0.818181818)=0.8451134217. Critical=11.344866730. Name the conditioning distribution, show the statistic and df, then state a contextual decision. math-sheet.com Page 6 of 8
Math Sheet Name Score Teacher Date Chi-Square Goodness-of-Fit and Independence Tests Build expected counts before calculating Pearson X2 or likelihood-ratio G. Treat 0 log(0/E) as 0 and check count adequacy. 7. Observed counts are (1,3,3,3,5) across 5 categories. H0 assigns equal probabilities. Use Pearson X2 at alpha=0.05 and decide whether the chi-square approximation is adequate. Assumptions: Counts are independent and categories are mutually exclusive; expected-count adequacy must be checked. Reference: Expected counts are (3, 3, 3, 3, 3). Use X2=sum (O-E)^2/E. df=k-1-0=4; Chi-square reference: P(ChiSq_4>=2.666666667)=0.6150599889. Critical=9.487729037. Name the conditioning distribution, show the statistic and df, then state a contextual decision. math-sheet.com Page 7 of 8
Math Sheet Name Score Teacher Date Chi-Square Goodness-of-Fit and Independence Tests Build expected counts before calculating Pearson X2 or likelihood-ratio G. Treat 0 log(0/E) as 0 and check count adequacy. 8. Observed counts are (8,11,14) across 3 categories. H0 assigns equal probabilities. Use likelihood-ratio G at alpha=0.1. Assumptions: Counts are independent and categories are mutually exclusive; expected-count adequacy must be checked. Reference: Expected counts are (11, 11, 11). Use 0 log(0/E)=0 in G=2 sum O log(O/E). df=k-1-0=2; Chi-square reference: P(ChiSq_2>=1.657277893)=0.4366431768. Critical=4.605170186. Name the conditioning distribution, show the statistic and df, then state a contextual decision. math-sheet.com Page 8 of 8