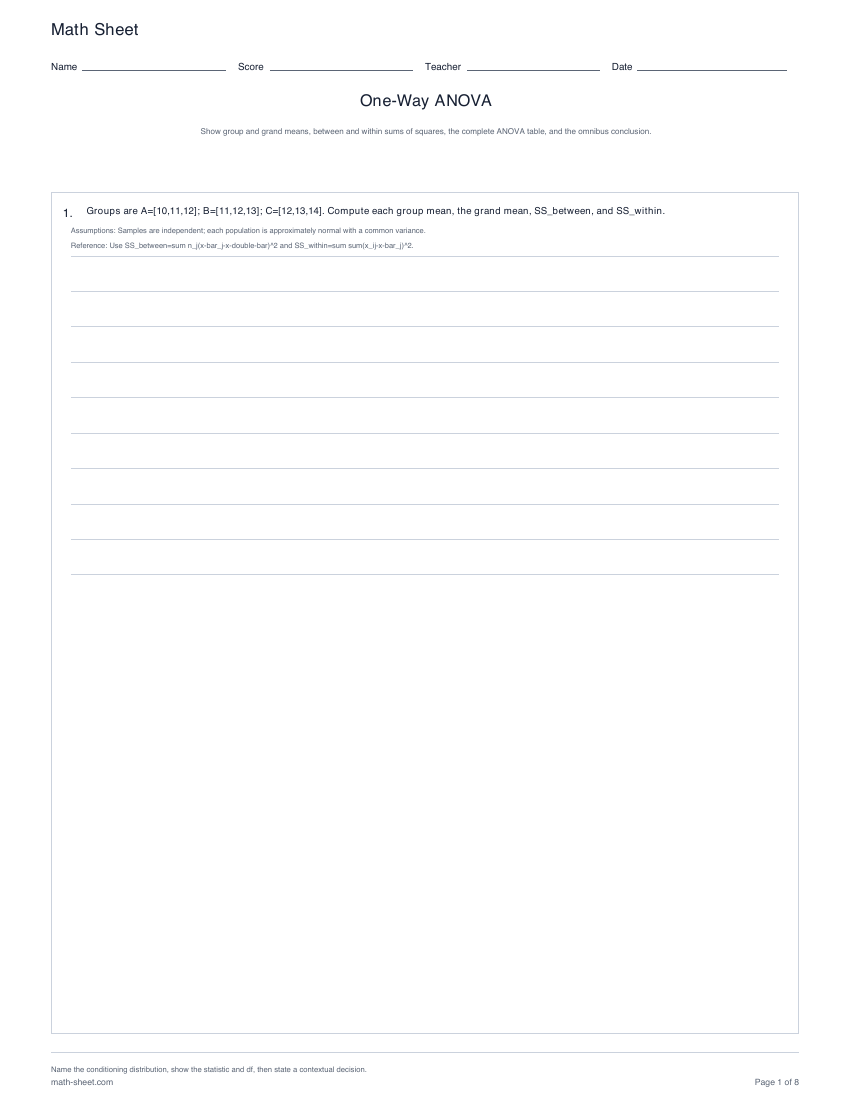
Math Sheet Name Score Teacher Date One-Way ANOVA Show group and grand means, between and within sums of squares, the complete ANOVA table, and the omnibus conclusion. 1. Groups are A=[10,11,12]; B=[11,12,13]; C=[12,13,14]. Compute each group mean, the grand mean, SS_between, and SS_within. Assumptions: Samples are independent; each population is approximately normal with a common variance. Reference: Use SS_between=sum n_j(x-bar_j-x-double-bar)^2 and SS_within=sum sum(x_ij-x-bar_j)^2. Name the conditioning distribution, show the statistic and df, then state a contextual decision. math-sheet.com Page 1 of 8
Math Sheet Name Score Teacher Date One-Way ANOVA Show group and grand means, between and within sums of squares, the complete ANOVA table, and the omnibus conclusion. 2. Groups are A=[12,13,14,15]; B=[14,15,16,17]; C=[16,17,18,19]; D=[19,20,21,22]. Complete the between, within, and total rows of the one-way ANOVA table, then test equal population means at alpha=0.1. Assumptions: Samples are independent; each population is approximately normal with a common variance. Reference: Table columns are source, SS, df, MS, and F (F only in the between row). F reference: P(F_3,12>=21.400000000)=0.0000416005; critical F=2.605524921. Name the conditioning distribution, show the statistic and df, then state a contextual decision. math-sheet.com Page 2 of 8
Math Sheet Name Score Teacher Date One-Way ANOVA Show group and grand means, between and within sums of squares, the complete ANOVA table, and the omnibus conclusion. 3. Groups are A=[14,15,16,17,18]; B=[17,18,19,20,21]; C=[20,21,22,23,24]. Given MS_between=45 and MS_within=2.5, perform the omnibus F test of equal population means at alpha=0.01; report F, its degrees of freedom, the p-value, and a contextual interpretation. Assumptions: Samples are independent; each population is approximately normal with a common variance. Reference: F=MS_between/MS_within with df=(2,12). F reference: P(F_2,12>=18.000000000)=0.0002441406; critical F=6.926608140. Name the conditioning distribution, show the statistic and df, then state a contextual decision. math-sheet.com Page 3 of 8
Math Sheet Name Score Teacher Date One-Way ANOVA Show group and grand means, between and within sums of squares, the complete ANOVA table, and the omnibus conclusion. 4. Groups are A=[16,17,18]; B=[17,18,19]; C=[18,19,20]; D=[20,21,22]. Compute each group mean, the grand mean, SS_between, and SS_within. Assumptions: Samples are independent; each population is approximately normal with a common variance. Reference: Use SS_between=sum n_j(x-bar_j-x-double-bar)^2 and SS_within=sum sum(x_ij-x-bar_j)^2. Name the conditioning distribution, show the statistic and df, then state a contextual decision. math-sheet.com Page 4 of 8
Math Sheet Name Score Teacher Date One-Way ANOVA Show group and grand means, between and within sums of squares, the complete ANOVA table, and the omnibus conclusion. 5. Groups are A=[18,19,20,21]; B=[20,21,22,23]; C=[22,23,24,25]. Given MS_between=16 and MS_within=1.6667, perform the omnibus F test of equal population means at alpha=0.1; report F, its degrees of freedom, the p-value, and a contextual interpretation. Assumptions: Samples are independent; each population is approximately normal with a common variance. Reference: F=MS_between/MS_within with df=(2,9). F reference: P(F_2,9>=9.600000000)=0.0058609809; critical F=3.006452417. Name the conditioning distribution, show the statistic and df, then state a contextual decision. math-sheet.com Page 5 of 8
Math Sheet Name Score Teacher Date One-Way ANOVA Show group and grand means, between and within sums of squares, the complete ANOVA table, and the omnibus conclusion. 6. Groups are A=[20,21,22,23,24]; B=[23,24,25,26,27]; C=[26,27,28,29,30]; D=[30,31,32,33,34]. Complete the between, within, and total rows of the one-way ANOVA table, then test equal population means at alpha=0.01. Assumptions: Samples are independent; each population is approximately normal with a common variance. Reference: Table columns are source, SS, df, MS, and F (F only in the between row). F reference: P(F_3,16>=36.500000000)=0.0000002194; critical F=5.292214046. Name the conditioning distribution, show the statistic and df, then state a contextual decision. math-sheet.com Page 6 of 8
Math Sheet Name Score Teacher Date One-Way ANOVA Show group and grand means, between and within sums of squares, the complete ANOVA table, and the omnibus conclusion. 7. Groups are A=[22,23,24]; B=[23,24,25]; C=[24,25,26]. Complete the between, within, and total rows of the one-way ANOVA table, then test equal population means at alpha=0.05. Assumptions: Samples are independent; each population is approximately normal with a common variance. Reference: Table columns are source, SS, df, MS, and F (F only in the between row). F reference: P(F_2,6>=3.000000000)=0.1250000000; critical F=5.143252850. Name the conditioning distribution, show the statistic and df, then state a contextual decision. math-sheet.com Page 7 of 8
Math Sheet Name Score Teacher Date One-Way ANOVA Show group and grand means, between and within sums of squares, the complete ANOVA table, and the omnibus conclusion. 8. Groups are A=[24,25,26,27]; B=[26,27,28,29]; C=[28,29,30,31]; D=[31,32,33,34]. Compute each group mean, the grand mean, SS_between, and SS_within. Assumptions: Samples are independent; each population is approximately normal with a common variance. Reference: Use SS_between=sum n_j(x-bar_j-x-double-bar)^2 and SS_within=sum sum(x_ij-x-bar_j)^2. Name the conditioning distribution, show the statistic and df, then state a contextual decision. math-sheet.com Page 8 of 8