Statistics practice

Multiple Regression Introduction worksheets

Use a supplied two-predictor equation to identify variables, predict, calculate residuals and SSE, and write the least-squares objective.

Ready-made English PDF · fixed settings

Customization below makes a separate PDF.

Fixed English ready-made files. Custom settings below apply only to the configured PDF.

Ready to print

Start with a ready-made worksheet

Use the supplied coefficients; do not refit unless asked. Interpret each slope while holding the other predictor fixed.

Download the practice pages alone, or include a separate answer key or teacher model. Longer activities may use more than one page.

Customize this worksheet

Paper sizes and printing help · More statistics activities

Make every model comparison auditable

Finite data tables, printed transformed values, and supplied coefficients let students reproduce every residual, SSE, and interpretation on paper.

Learning objective

What this activity builds

Interpret and calculate with an introductory two-predictor model while holding the other included predictor fixed.

Worked example

What does b1 mean in yhat=b0+b1x1+b2x2?

It is the predicted change for a one-unit increase in x1 while x2 is held fixed.

This comparison isolates the model's x1 coefficient, but does not by itself prove causation.

Teaching notes

Make the practice count

  • Keep observed and predicted values separate.
  • Write one squared residual per row.
  • Avoid adding coefficient inference beyond this introductory scope.

Make it yours

Customize the practice

Choose your options, update the preview, then download the exact same pages.

Choose regression modes, problem count, paper size, and seed.

Worksheet settings

Question types
Page note and reproducible seed

The same settings and seed make the same questions. Shared links include your page note; leave personal information out.

Configured PDF · Multiple Regression Introduction · US Letter

Preview ready. Download includes these exact pages.

4 student pages
Enlarged pages scroll. PDF size stays the same.
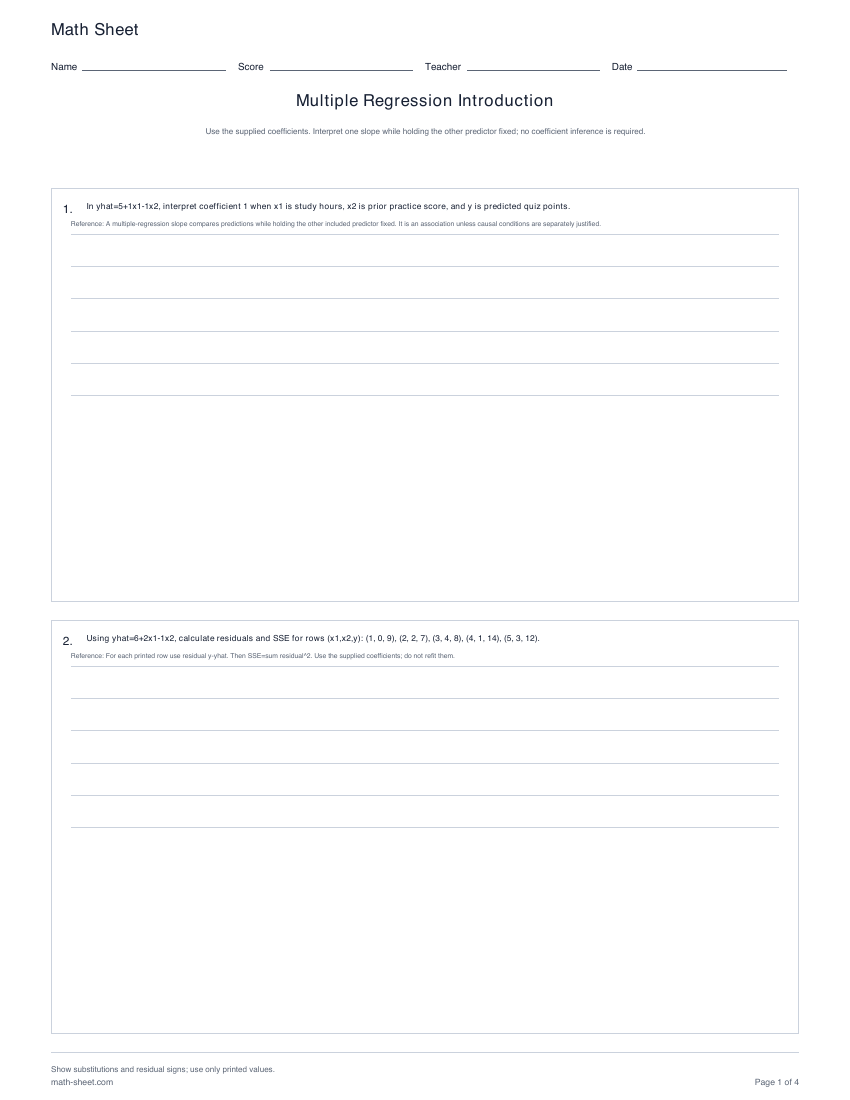
Math SheetNameScoreTeacherDateMultiple Regression IntroductionUse the supplied coefficients. Interpret one slope while holding the other predictor fixed; no coefficient inference is required.1.In yhat=5+1x1-1x2, interpret coefficient 1 when x1 is study hours, x2 is prior practice score, and y is predicted quiz points.Reference: A multiple-regression slope compares predictions while holding the other included predictor fixed. It is an association unless causal conditions are separately justified.2.Using yhat=6+2x1-1x2, calculate residuals and SSE for rows (x1,x2,y): (1, 0, 9), (2, 2, 7), (3, 4, 8), (4, 1, 14), (5, 3, 12).Reference: For each printed row use residual y-yhat. Then SSE=sum residual^2. Use the supplied coefficients; do not refit them.Show substitutions and residual signs; use only printed values.math-sheet.comPage 1 of 4
Math SheetNameScoreTeacherDateMultiple Regression IntroductionUse the supplied coefficients. Interpret one slope while holding the other predictor fixed; no coefficient inference is required.3.For rows (x1,x2,y): (1, 1, 5), (2, 3, 7), (3, 0, 14), (4, 2, 13), (5, 4, 15), (6, 1, 22), write the least-squares objective in b0,b1,b2 for yhat=b0+b1x1+b2x2. Do not solve it.Reference: Substitute each row into sum[y-(b0+b1 x1+b2 x2)]^2. Keep every one of the 4-6 printed rows.4.A model predicts weekly plant growth y (cm) from sunlight x1 (hours/day) and water x2 (liters/week): yhat=5+4x1-1x2. Identify the response and both predictors.Reference: The response is the outcome on the left side. Predictors appear on the right side and are used to form predictions.Show substitutions and residual signs; use only printed values.math-sheet.comPage 2 of 4
Math SheetNameScoreTeacherDateMultiple Regression IntroductionUse the supplied coefficients. Interpret one slope while holding the other predictor fixed; no coefficient inference is required.5.For yhat=4+1x1-2x2 and observed row (x1,x2,y)=(1,0,4), calculate the prediction and residual y-yhat.Reference: Substitute both predictors into the supplied equation. Residual=observed-predicted, so its sign matters.6.For yhat=5+2x1-2x2 and observed row (x1,x2,y)=(1,1,5), calculate the prediction and residual y-yhat.Reference: Substitute both predictors into the supplied equation. Residual=observed-predicted, so its sign matters.Show substitutions and residual signs; use only printed values.math-sheet.comPage 3 of 4
Math SheetNameScoreTeacherDateMultiple Regression IntroductionUse the supplied coefficients. Interpret one slope while holding the other predictor fixed; no coefficient inference is required.7.In yhat=6+3x1-2x2, interpret coefficient 3 when x1 is training sessions, x2 is baseline time, and y is predicted race time seconds.Reference: A multiple-regression slope compares predictions while holding the other included predictor fixed. It is an association unless causal conditions are separately justified.8.For rows (x1,x2,y): (1, 3, 1), (2, 0, 12), (3, 2, 13), (4, 4, 11), (5, 1, 22), write the least-squares objective in b0,b1,b2 for yhat=b0+b1x1+b2x2. Do not solve it.Reference: Substitute each row into sum[y-(b0+b1 x1+b2 x2)]^2. Keep every one of the 4-6 printed rows.Show substitutions and residual signs; use only printed values.math-sheet.comPage 4 of 4

A useful next step

Related activities