Statistics practice

Least-Squares Curve Models worksheets

Compare supplied line, quadratic, cubic, and transformed exponential models using residuals and SSE.

Ready-made English PDF · fixed settings

Customization below makes a separate PDF.

Fixed English ready-made files. Custom settings below apply only to the configured PDF.

Ready to print

Start with a ready-made worksheet

Use every printed value and coefficient. Show residual signs before squaring and round only the reported result.

Download the practice pages alone, or include a separate answer key or teacher model. Longer activities may use more than one page.

Customize this worksheet

Paper sizes and printing help · More statistics activities

Make every model comparison auditable

Finite data tables, printed transformed values, and supplied coefficients let students reproduce every residual, SSE, and interpretation on paper.

Learning objective

What this activity builds

Evaluate finite curve fits, solve bounded quadratic normal equations, and recognize models linear in their coefficients.

Worked example

Why can y=a+b sin(x)+cx^2 use linear least squares?

The unknown coefficients a, b, and c appear linearly.

The functions of x are known columns once x is observed.

Teaching notes

Make the practice count

  • Compare SSE only on the same rows.
  • Keep transformed log values visible.
  • Separate nonlinear curves from nonlinearity in coefficients.

Make it yours

Customize the practice

Choose your options, update the preview, then download the exact same pages.

Choose regression modes, problem count, paper size, and seed.

Worksheet settings

Question types
Page note and reproducible seed

The same settings and seed make the same questions. Shared links include your page note; leave personal information out.

Configured PDF · Least-Squares Curve Models · US Letter

Preview ready. Download includes these exact pages.

4 student pages
Enlarged pages scroll. PDF size stays the same.
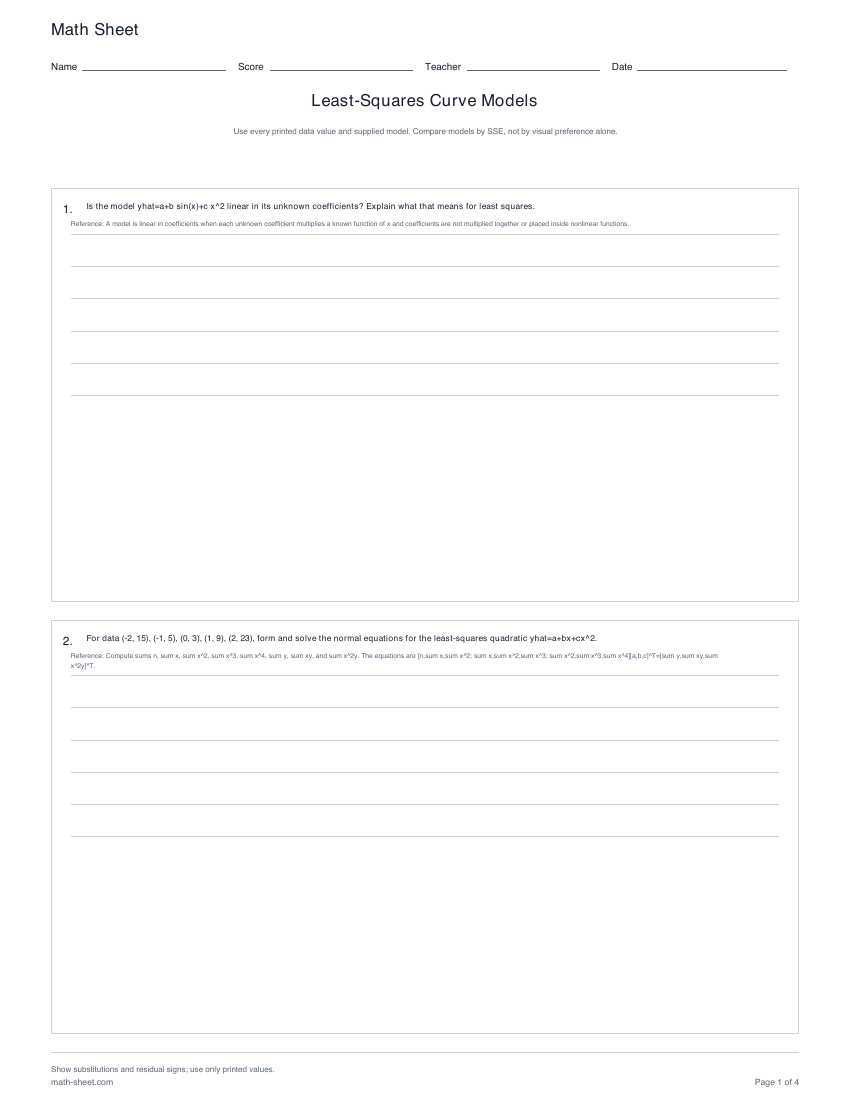
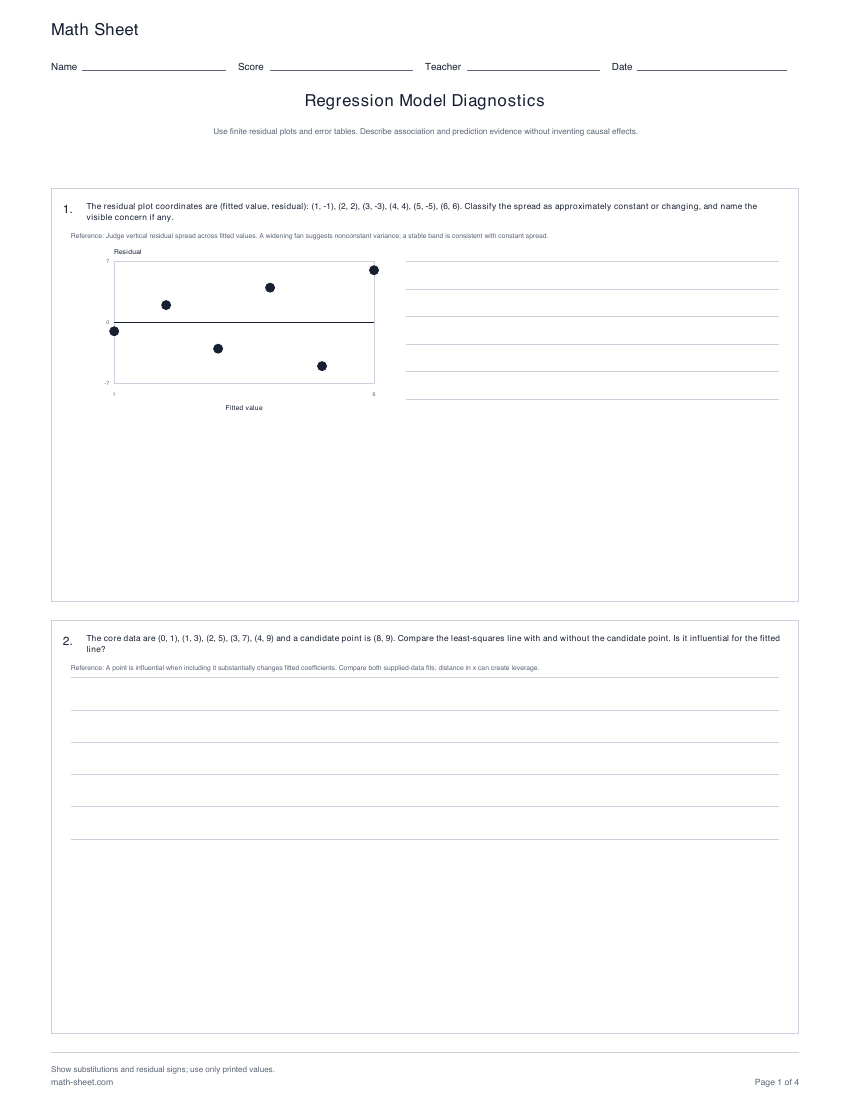
Math SheetNameScoreTeacherDateLeast-Squares Curve ModelsUse every printed data value and supplied model. Compare models by SSE, not by visual preference alone.1.Is the model yhat=a+b sin(x)+c x^2 linear in its unknown coefficients? Explain what that means for least squares.Reference: A model is linear in coefficients when each unknown coefficient multiplies a known function of x and coefficients are not multiplied together or placed inside nonlinear functions.2.For data (-2, 15), (-1, 5), (0, 3), (1, 9), (2, 23), form and solve the normal equations for the least-squares quadratic yhat=a+bx+cx^2.Reference: Compute sums n, sum x, sum x^2, sum x^3, sum x^4, sum y, sum xy, and sum x^2y. The equations are [n,sum x,sum x^2; sum x,sum x^2,sum x^3; sum x^2,sum x^3,sum x^4][a,b,c]^T=[sum y,sum xy,sumx^2y]^T.Show substitutions and residual signs; use only printed values.math-sheet.comPage 1 of 4
Math SheetNameScoreTeacherDateLeast-Squares Curve ModelsUse every printed data value and supplied model. Compare models by SSE, not by visual preference alone.3.For an exponential model y=A exp(kx), the supplied transformed data (x, ln y) are (0, 0.45), (1, 0.75), (2, 1.05), (3, 1.35), (4, 1.65). Fit the least-squares line ln y=alpha+kx, thengive A and k.Reference: Use only the printed ln y values. Fit a line to (x,ln y); then A=exp(alpha). Report A to three decimals.4.For data (-2, 8), (-1, 6), (0, 4), (1, 6), (2, 8), evaluate SSE for L(x)=4+0.5x, Q(x)=4+x^2, and C(x)=4-0.25x+x^2+0.1x^3. Which supplied model has the smallest SSE?Reference: For each row compute residual y-yhat, square it, then sum. SSE=sum(y-yhat)^2. Use the printed coefficients exactly.Show substitutions and residual signs; use only printed values.math-sheet.comPage 2 of 4
Math SheetNameScoreTeacherDateLeast-Squares Curve ModelsUse every printed data value and supplied model. Compare models by SSE, not by visual preference alone.5.For an exponential model y=A exp(kx), the supplied transformed data (x, ln y) are (0, 0.55), (1, 0.75), (2, 0.95), (3, 1.15), (4, 1.35). Fit the least-squares line ln y=alpha+kx, thengive A and k.Reference: Use only the printed ln y values. Fit a line to (x,ln y); then A=exp(alpha). Report A to three decimals.6.Is the model yhat=a+b x+c cos(x) linear in its unknown coefficients? Explain what that means for least squares.Reference: A model is linear in coefficients when each unknown coefficient multiplies a known function of x and coefficients are not multiplied together or placed inside nonlinear functions.Show substitutions and residual signs; use only printed values.math-sheet.comPage 3 of 4
Math SheetNameScoreTeacherDateLeast-Squares Curve ModelsUse every printed data value and supplied model. Compare models by SSE, not by visual preference alone.7.For data (-2, 17), (-1, 4), (0, 1), (1, 8), (2, 25), form and solve the normal equations for the least-squares quadratic yhat=a+bx+cx^2.Reference: Compute sums n, sum x, sum x^2, sum x^3, sum x^4, sum y, sum xy, and sum x^2y. The equations are [n,sum x,sum x^2; sum x,sum x^2,sum x^3; sum x^2,sum x^3,sum x^4][a,b,c]^T=[sum y,sum xy,sumx^2y]^T.8.For data (-2, 13), (-1, 9), (0, 9), (1, 9), (2, 13), evaluate SSE for L(x)=8+0.5x, Q(x)=8+x^2, and C(x)=8-0.25x+x^2+0.1x^3. Which supplied model has the smallest SSE?Reference: For each row compute residual y-yhat, square it, then sum. SSE=sum(y-yhat)^2. Use the printed coefficients exactly.Show substitutions and residual signs; use only printed values.math-sheet.comPage 4 of 4

A useful next step

Related activities