Statistics practice

Regression Model Diagnostics worksheets

Read finite residual plots, compare held-out errors, assess influential points, and reason about regression to the mean.

Ready-made English PDF · fixed settings

Customization below makes a separate PDF.

Fixed English ready-made files. Custom settings below apply only to the configured PDF.

Ready to print

Start with a ready-made worksheet

Base each conclusion on the printed plot coordinates or error table. Describe evidence rather than inventing a causal mechanism.

Download the practice pages alone, or include a separate answer key or teacher model. Longer activities may use more than one page.

Customize this worksheet

Paper sizes and printing help · More statistics activities

Make every model comparison auditable

Finite data tables, printed transformed values, and supplied coefficients let students reproduce every residual, SSE, and interpretation on paper.

Learning objective

What this activity builds

Use concrete diagnostic evidence to judge spread, complexity, influence, and repeated extreme observations without causal overreach.

Worked example

Training SSE falls but held-out SSE rises. What does that suggest?

The more complex model is overfitting.

It fits training details that do not improve new-row prediction.

Teaching notes

Make the practice count

  • Compare residual envelopes across fitted values.
  • Refit with and without a candidate influential point.
  • State that regression to the mean can occur without treatment.

Make it yours

Customize the practice

Choose your options, update the preview, then download the exact same pages.

Choose regression modes, problem count, paper size, and seed.

Worksheet settings

Question types
Page note and reproducible seed

The same settings and seed make the same questions. Shared links include your page note; leave personal information out.

Configured PDF · Regression Model Diagnostics · US Letter

Preview ready. Download includes these exact pages.

4 student pages
Enlarged pages scroll. PDF size stays the same.
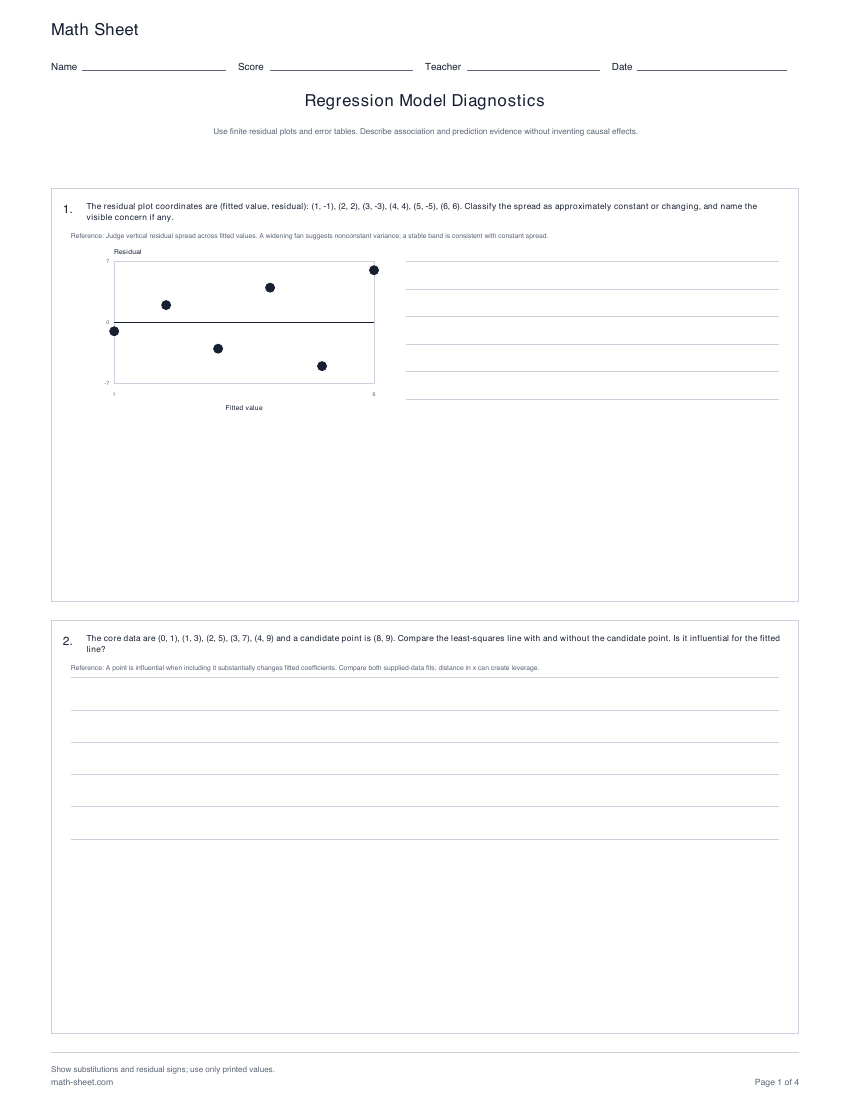
Math SheetNameScoreTeacherDateRegression Model DiagnosticsUse finite residual plots and error tables. Describe association and prediction evidence without inventing causal effects.1.The residual plot coordinates are (fitted value, residual): (1, -1), (2, 2), (3, -3), (4, 4), (5, -5), (6, 6). Classify the spread as approximately constant or changing, and name thevisible concern if any.Reference: Judge vertical residual spread across fitted values. A widening fan suggests nonconstant variance; a stable band is consistent with constant spread.ResidualFitted value16-7072.The core data are (0, 1), (1, 3), (2, 5), (3, 7), (4, 9) and a candidate point is (8, 9). Compare the least-squares line with and without the candidate point. Is it influential for the fittedline?Reference: A point is influential when including it substantially changes fitted coefficients. Compare both supplied-data fits; distance in x can create leverage.Show substitutions and residual signs; use only printed values.math-sheet.comPage 1 of 4
Math SheetNameScoreTeacherDateRegression Model DiagnosticsUse finite residual plots and error tables. Describe association and prediction evidence without inventing causal effects.3.A group selected for an unusually high first score has mean 96. On a comparable repeat with no intervention, its mean is 84; the population mean is 75. Explain the changeusing regression to the mean.Reference: Extreme observed groups often include temporary variation. On repetition, their average tends to be less extreme even without a causal treatment effect.4.Three model complexities have (training SSE, held-out SSE): simple=(19,17), medium=(13,8), complex=(3,16). Choose for future prediction and explain the complexity tradeoff.Reference: Training error often falls with complexity. Select predictive complexity using held-out error because it tests new rows.Show substitutions and residual signs; use only printed values.math-sheet.comPage 2 of 4
Math SheetNameScoreTeacherDateRegression Model DiagnosticsUse finite residual plots and error tables. Describe association and prediction evidence without inventing causal effects.5.The residual plot coordinates are (fitted value, residual): (5, -1), (6, 2), (7, -3), (8, 4), (9, -5), (10, 6). Classify the spread as approximately constant or changing, and name thevisible concern if any.Reference: Judge vertical residual spread across fitted values. A widening fan suggests nonconstant variance; a stable band is consistent with constant spread.ResidualFitted value510-7076.The core data are (0, 1), (1, 3), (2, 5), (3, 7), (4, 9) and a candidate point is (8, 4). Compare the least-squares line with and without the candidate point. Is it influential for the fittedline?Reference: A point is influential when including it substantially changes fitted coefficients. Compare both supplied-data fits; distance in x can create leverage.Show substitutions and residual signs; use only printed values.math-sheet.comPage 3 of 4
Math SheetNameScoreTeacherDateRegression Model DiagnosticsUse finite residual plots and error tables. Describe association and prediction evidence without inventing causal effects.7.A group selected for an unusually high first score has mean 91. On a comparable repeat with no intervention, its mean is 83; the population mean is 75. Explain the changeusing regression to the mean.Reference: Extreme observed groups often include temporary variation. On repetition, their average tends to be less extreme even without a causal treatment effect.8.Three model complexities have (training SSE, held-out SSE): simple=(14,12), medium=(8,9), complex=(2,11). Choose for future prediction and explain the complexity tradeoff.Reference: Training error often falls with complexity. Select predictive complexity using held-out error because it tests new rows.Show substitutions and residual signs; use only printed values.math-sheet.comPage 4 of 4

A useful next step

Related activities