Statistics practice

Bootstrap Confidence Intervals worksheets

Build empirical PMFs, calculate supplied resample statistics, and form percentile and basic bootstrap intervals.

Ready-made English PDF · fixed settings

Customization below makes a separate PDF.

Fixed English ready-made files. Custom settings below apply only to the configured PDF.

Ready to print

Start with a ready-made worksheet

Use the supplied resample indices exactly. Classroom replicate counts illustrate mechanics and do not reliably estimate 95% coverage.

Download the practice pages alone, or include a separate answer key or teacher model. Longer activities may use more than one page.

Customize this worksheet

Paper sizes and printing help · More statistics activities

Keep assumptions beside the interval

Every task states the sampling model, standard-error source, quantile convention, and rounding reference needed to reproduce the worked endpoint.

Learning objective

What this activity builds

Follow empirical and parametric resampling mechanics and interpret nominal versus observed coverage without overstating short runs.

Worked example

What does index row 1,1,3 select?

The first observation twice and the third observation once.

Bootstrap sampling is with replacement.

Teaching notes

Make the practice count

  • Combine duplicate empirical masses.
  • Name the interpolation quantile rule.
  • Distinguish empirical resampling from fitted-model simulation.

Make it yours

Customize the practice

Choose your options, update the preview, then download the exact same pages.

Choose interval or bootstrap modes, problem count, paper size, and seed.

Worksheet settings

Question types
Page note and reproducible seed

The same settings and seed make the same questions. Shared links include your page note; leave personal information out.

Configured PDF · Bootstrap Confidence Intervals · US Letter

Preview ready. Download includes these exact pages.

4 student pages
Enlarged pages scroll. PDF size stays the same.
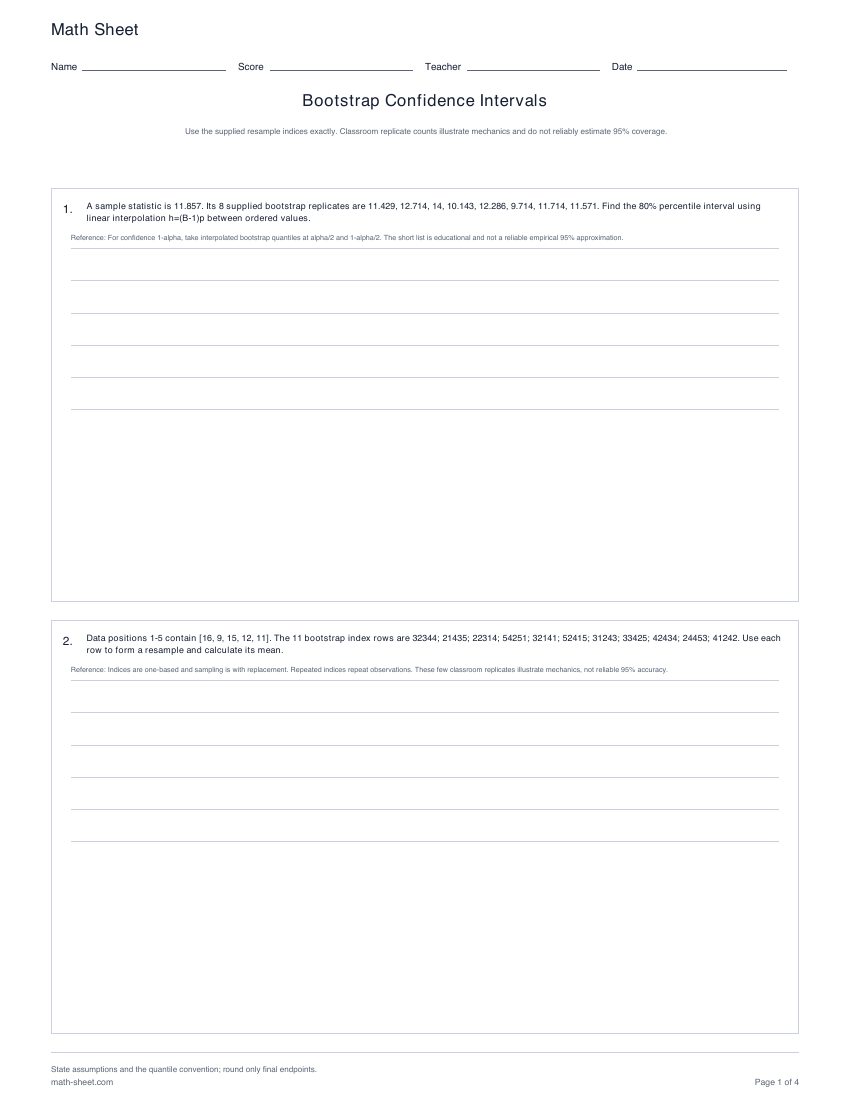
Math SheetNameScoreTeacherDateBootstrap Confidence IntervalsUse the supplied resample indices exactly. Classroom replicate counts illustrate mechanics and do not reliably estimate 95% coverage.1.A sample statistic is 11.857. Its 8 supplied bootstrap replicates are 11.429, 12.714, 14, 10.143, 12.286, 9.714, 11.714, 11.571. Find the 80% percentile interval usinglinear interpolation h=(B-1)p between ordered values.Reference: For confidence 1-alpha, take interpolated bootstrap quantiles at alpha/2 and 1-alpha/2. The short list is educational and not a reliable empirical 95% approximation.2.Data positions 1-5 contain [16, 9, 15, 12, 11]. The 11 bootstrap index rows are 32344; 21435; 22314; 54251; 32141; 52415; 31243; 33425; 42434; 24453; 41242. Use eachrow to form a resample and calculate its mean.Reference: Indices are one-based and sampling is with replacement. Repeated indices repeat observations. These few classroom replicates illustrate mechanics, not reliable 95% accuracy.State assumptions and the quantile convention; round only final endpoints.math-sheet.comPage 1 of 4
Math SheetNameScoreTeacherDateBootstrap Confidence IntervalsUse the supplied resample indices exactly. Classroom replicate counts illustrate mechanics and do not reliably estimate 95% coverage.3.Data positions 1-6 contain [17, 10, 16, 13, 12, 13]. The 14 bootstrap index rows are 623551; 215543; 561636; 125132; 131313; 152224; 212121; 161136; 231241; 546253;665453; 566563; 163331; 335351. Use each row to form a resample and calculate its median.Reference: Indices are one-based and sampling is with replacement. Repeated indices repeat observations. These few classroom replicates illustrate mechanics, not reliable 95% accuracy.4.The original estimate is 14 and 17 bootstrap replicates are 17, 17, 14, 14, 14, 17, 17, 14, 13, 17, 14, 14, 17, 14, 17, 14, 17. Find the 80% basic interval using linearlyinterpolated quantiles h=(B-1)p.Reference: If bootstrap quantiles are q_low and q_high, the basic interval is (2 theta-hat-q_high, 2 theta-hat-q_low).State assumptions and the quantile convention; round only final endpoints.math-sheet.comPage 2 of 4
Math SheetNameScoreTeacherDateBootstrap Confidence IntervalsUse the supplied resample indices exactly. Classroom replicate counts illustrate mechanics and do not reliably estimate 95% coverage.5.Observed data are 8, 12, 18, 15, 14. A normal model is fitted with mean 13.4 and SD 6. Identify the parametric bootstrap step represented by synthetic resample 13.4,19.4, 7.4, 13.4, 19.4, and compute its mean.Reference: A parametric bootstrap simulates new samples from the fitted distribution, then recomputes the statistic. It does not resample the observed rows directly.6.For data 9, 13, 8, 16, 15, 16, construct the empirical PMF, combining repeated observations.Reference: The empirical probability at a distinct value is its sample frequency divided by n.State assumptions and the quantile convention; round only final endpoints.math-sheet.comPage 3 of 4
Math SheetNameScoreTeacherDateBootstrap Confidence IntervalsUse the supplied resample indices exactly. Classroom replicate counts illustrate mechanics and do not reliably estimate 95% coverage.7.A simulation of 26 confidence intervals at nominal 95% coverage contains the true parameter 25 times. Find observed coverage and interpret the difference.Reference: Observed coverage is covered/total. With only a few dozen repetitions, sampling variation is substantial; it neither proves nor disproves nominal long-run coverage.8.For data 11, 15, 10, 18, 17, construct the empirical PMF, combining repeated observations.Reference: The empirical probability at a distinct value is its sample frequency divided by n.State assumptions and the quantile convention; round only final endpoints.math-sheet.comPage 4 of 4

A useful next step

Related activities