Statistics practice

Normal-Data Confidence Intervals worksheets

Construct z and t mean intervals, chi-square variance intervals, inspect coverage, and invert a two-sided test.

Ready-made English PDF · fixed settings

Customization below makes a separate PDF.

Fixed English ready-made files. Custom settings below apply only to the configured PDF.

Ready to print

Start with a ready-made worksheet

Use lower-tail printed quantiles. State whether population variance is known, unknown, or itself the target.

Download the practice pages alone, or include a separate answer key or teacher model. Longer activities may use more than one page.

Customize this worksheet

Paper sizes and printing help · More statistics activities

Keep assumptions beside the interval

Every task states the sampling model, standard-error source, quantile convention, and rounding reference needed to reproduce the worked endpoint.

Learning objective

What this activity builds

Match known-variance, unknown-variance, and variance-target settings to correct lower-tail quantiles and interpretations.

Worked example

Why is the upper chi-square quantile in the lower variance endpoint?

Dividing by the larger positive quantile gives the smaller endpoint.

The pivot inequality reverses the order when solved for variance.

Teaching notes

Make the practice count

  • Label known sigma versus sample s.
  • Write chi-square quantile tails explicitly.
  • Interpret confidence as repeated-sample coverage.

Make it yours

Customize the practice

Choose your options, update the preview, then download the exact same pages.

Choose interval or bootstrap modes, problem count, paper size, and seed.

Worksheet settings

Question types
Page note and reproducible seed

The same settings and seed make the same questions. Shared links include your page note; leave personal information out.

Configured PDF · Normal-Data Confidence Intervals · US Letter

Preview ready. Download includes these exact pages.

4 student pages
Enlarged pages scroll. PDF size stays the same.
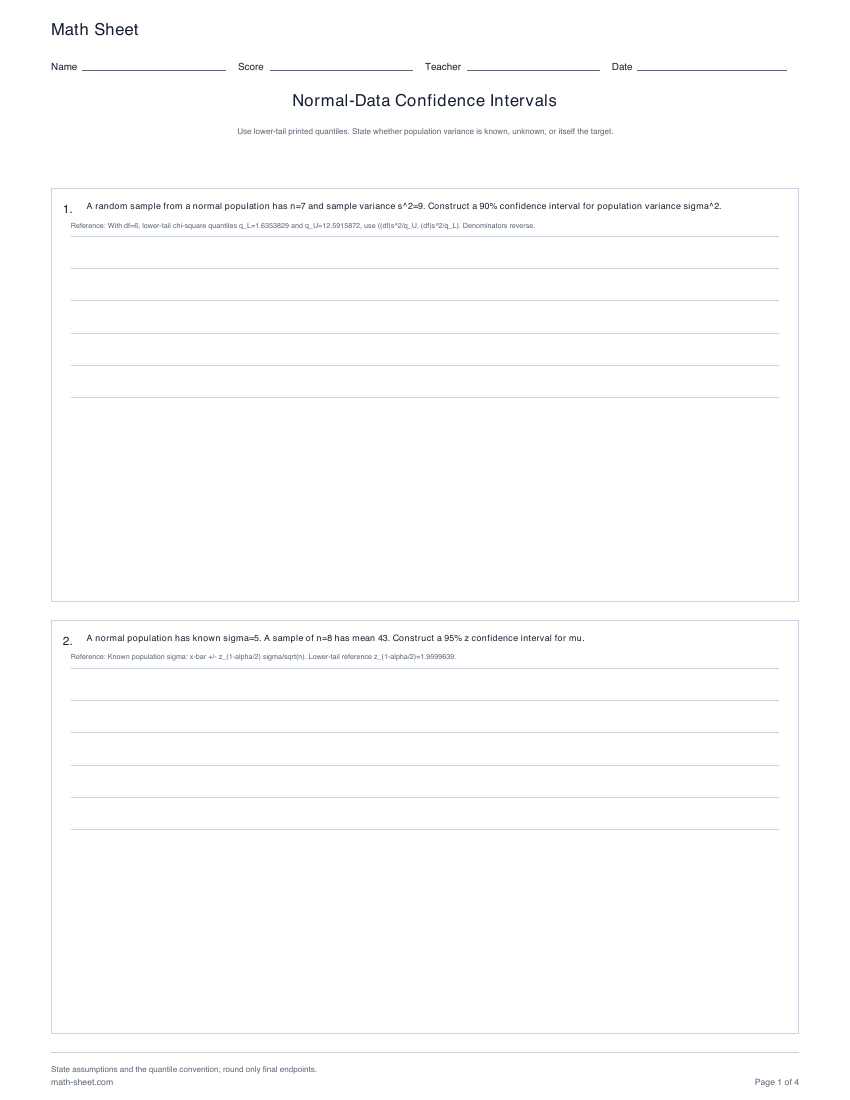
Math SheetNameScoreTeacherDateNormal-Data Confidence IntervalsUse lower-tail printed quantiles. State whether population variance is known, unknown, or itself the target.1.A random sample from a normal population has n=7 and sample variance s^2=9. Construct a 90% confidence interval for population variance sigma^2.Reference: With df=6, lower-tail chi-square quantiles q_L=1.6353829 and q_U=12.5915872, use ((df)s^2/q_U, (df)s^2/q_L). Denominators reverse.2.A normal population has known sigma=5. A sample of n=8 has mean 43. Construct a 95% z confidence interval for mu.Reference: Known population sigma: x-bar +/- z_(1-alpha/2) sigma/sqrt(n). Lower-tail reference z_(1-alpha/2)=1.9599639.State assumptions and the quantile convention; round only final endpoints.math-sheet.comPage 1 of 4
Math SheetNameScoreTeacherDateNormal-Data Confidence IntervalsUse lower-tail printed quantiles. State whether population variance is known, unknown, or itself the target.3.For known sigma=6, n=9, and x-bar=46, invert the two-sided level 0.05 z test of H0: mu=mu0. Give all mu0 values not rejected.Reference: The two-sided z test keeps H0 when |(x-bar-mu0)/(sigma/sqrt(n))|<=z_0.975, with z_0.975=1.9599639. Solving gives the matching 95% confidence interval.4.Ten repeated-sample intervals for the same parameter are (66,70), (66,72), (75,79), (65,71), (67,71), (67,73), (66,70), (73,79), (68,72), (65,71). The true value is 69. Findobserved coverage and interpret it.Reference: An interval covers when lower <= true value <= upper. Long-run confidence concerns the procedure across repeated samples, not a probability assigned to this fixed parameter.State assumptions and the quantile convention; round only final endpoints.math-sheet.comPage 2 of 4
Math SheetNameScoreTeacherDateNormal-Data Confidence IntervalsUse lower-tail printed quantiles. State whether population variance is known, unknown, or itself the target.5.A random sample from a normal population has n=11, x-bar=52, and sample SD s=7; population variance is unknown. Construct a 95% t confidence interval for mu.Reference: Unknown population sigma with normal data: x-bar +/- t_(1-alpha/2,n-1)s/sqrt(n). Lower-tail reference t_(1-alpha/2,10)=2.2281389.6.A student proposes x-bar +/- 1.5s/sqrt(n) as a data-based interval, where mu is the unknown population mean. Is it an interval statistic computable before mu isknown?Reference: An interval statistic may use observations and known constants, but its endpoints cannot contain the unknown target parameter.State assumptions and the quantile convention; round only final endpoints.math-sheet.comPage 3 of 4
Math SheetNameScoreTeacherDateNormal-Data Confidence IntervalsUse lower-tail printed quantiles. State whether population variance is known, unknown, or itself the target.7.Evaluate this statement: “There is a 86% probability that this fixed mu lies in the computed frequentist interval.”Reference: A frequentist confidence level is long-run procedure coverage. A Bayesian credible probability is conditional on a stated prior and model.8.A normal population has known sigma=11. A sample of n=14 has mean 61. Construct a 95% z confidence interval for mu.Reference: Known population sigma: x-bar +/- z_(1-alpha/2) sigma/sqrt(n). Lower-tail reference z_(1-alpha/2)=1.9599639.State assumptions and the quantile convention; round only final endpoints.math-sheet.comPage 4 of 4

A useful next step

Related activities