Statistics practice

Scatterplots and Correlation worksheets

Construct and read labeled scatterplots from actual paired observations, calculate Pearson r, and interpret linear association without claiming causation.

Ready-made English PDF · fixed settings

Customization below makes a separate PDF.

Fixed English ready-made files. Custom settings below apply only to the configured PDF.

Ready to print

Start with a ready-made worksheet

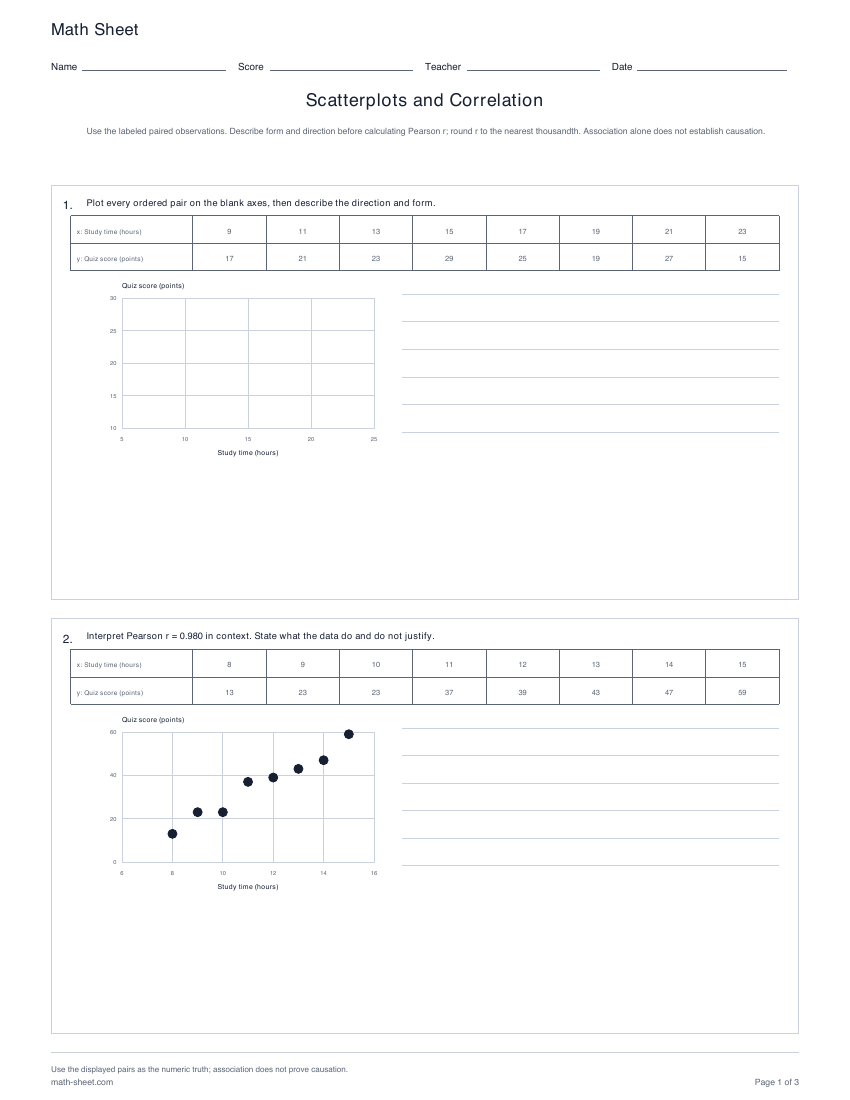
Use the labeled paired observations. Describe form and direction before calculating Pearson r; round r to the nearest thousandth. Association alone does not establish causation.

Download the practice pages alone, or include a separate answer key or teacher model. Longer activities may use more than one page.

Customize this worksheet

Paper sizes and printing help · More statistics activities

Keep the paired observations visible

Every plot and calculation comes from the labeled x and y table printed beside it. Construction tasks keep the student plot blank, while reading tasks provide the actual point cloud and worked keys complete each requested diagram.

Learning objective

What this activity builds

Use paired quantitative data to describe direction and form, calculate Pearson correlation, and distinguish association from causation.

Worked example

A scatterplot rises from left to right and has r = 0.82. What does that mean?

The sample has a strong positive linear association under the stated classroom cutoff.

The sign gives direction and the magnitude describes linear strength. It does not show that changing x causes y to change.

Teaching notes

Make the practice count

  • Plot every ordered pair from the table before describing the cloud.
  • Discuss form before relying on r; a curved pattern can have r near zero.
  • Treat the printed strength cutoffs as a classroom convention, not universal boundaries.

Make it yours

Customize the practice

Choose your options, update the preview, then download the exact same pages.

Choose paired-observation count, relationship patterns, construction/reading/Pearson/interpretation tasks, and problem count.

Worksheet settings

Question types
Relationship patterns
Page note and reproducible seed

The same settings and seed make the same questions. Shared links include your page note; leave personal information out.

Configured PDF · Scatterplots and Correlation · US Letter

Preview ready. Download includes these exact pages.

3 student pages
Enlarged pages scroll. PDF size stays the same.
Math SheetNameScoreTeacherDateScatterplots and CorrelationUse the labeled paired observations. Describe form and direction before calculating Pearson r; round r to the nearest thousandth. Association alone does not establish causation.1.Plot every ordered pair on the blank axes, then describe the direction and form.x: Study time (hours)911131517192123y: Quiz score (points)1721232925192715Quiz score (points)Study time (hours)51015202530252015102.Interpret Pearson r = 0.980 in context. State what the data do and do not justify.x: Study time (hours)89101112131415y: Quiz score (points)1323233739434759Quiz score (points)Study time (hours)68101214166040200Use the displayed pairs as the numeric truth; association does not prove causation.math-sheet.comPage 1 of 3
Math SheetNameScoreTeacherDateScatterplots and CorrelationUse the labeled paired observations. Describe form and direction before calculating Pearson r; round r to the nearest thousandth. Association alone does not establish causation.3.Calculate Pearson's correlation coefficient r from the displayed pairs.x: Study time (hours)810121416182022y: Quiz score (points)3935353130242317Quiz score (points)Study time (hours)510152025403020104.Use the supplied scatterplot to describe its direction and whether its form is linear or nonlinear.x: Study time (hours)56789101112y: Quiz score (points)35.523.515.511.511.515.523.535.5Quiz score (points)Study time (hours)46810121440302010Use the displayed pairs as the numeric truth; association does not prove causation.math-sheet.comPage 2 of 3
Math SheetNameScoreTeacherDateScatterplots and CorrelationUse the labeled paired observations. Describe form and direction before calculating Pearson r; round r to the nearest thousandth. Association alone does not establish causation.5.Calculate Pearson's correlation coefficient r from the displayed pairs.x: Study time (hours)68101214161820y: Quiz score (points)6656484040323018Quiz score (points)Study time (hours)5101520258060402006.Interpret Pearson r = 0.983 in context. State what the data do and do not justify.x: Study time (hours)678910111213y: Quiz score (points)1226283236485262Quiz score (points)Study time (hours)468101214806040200Use the displayed pairs as the numeric truth; association does not prove causation.math-sheet.comPage 3 of 3

A useful next step

Related activities

Printable linear regression and residuals worksheets preview

Statistics

Linear Regression and Residuals worksheets

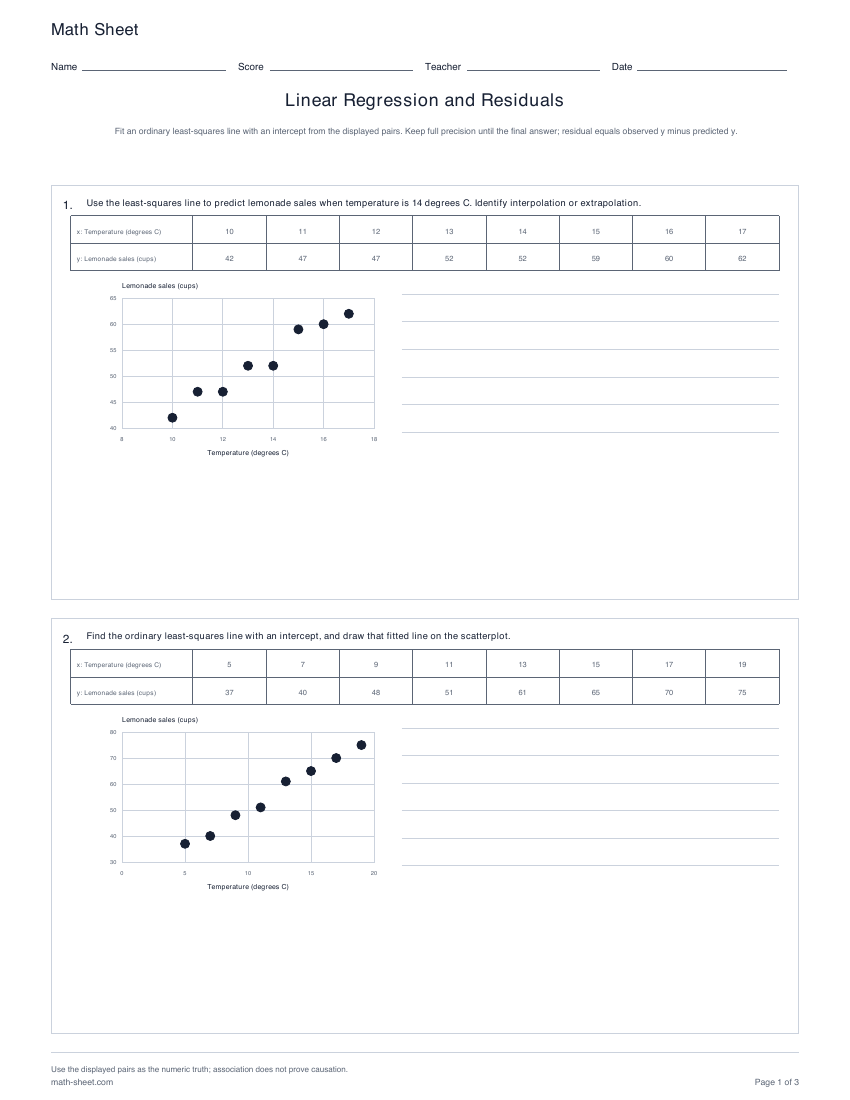
Fit ordinary least-squares lines with intercepts, predict responses, calculate observed-minus-predicted residuals, and identify extrapolation.

Preview and download