
Statistics
Scatterplots and Correlation worksheets
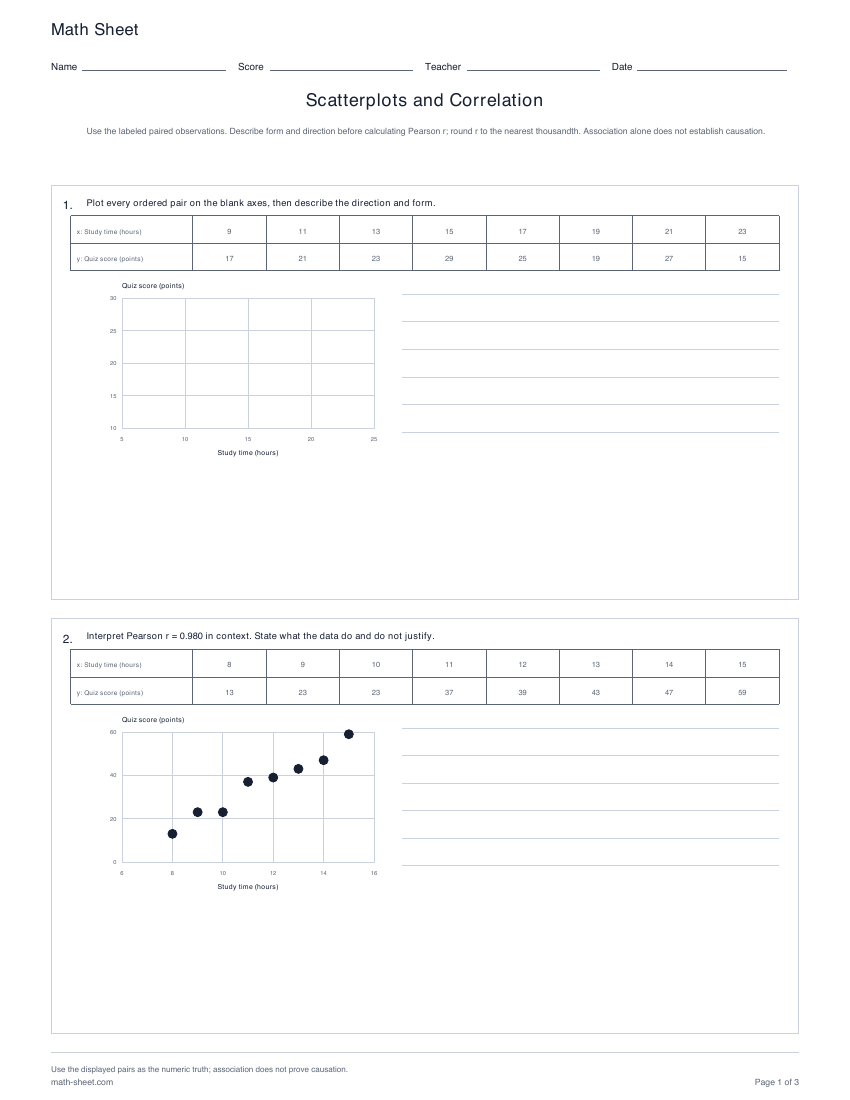
Construct and read labeled scatterplots from actual paired observations, calculate Pearson r, and interpret linear association without claiming causation.
Preview and downloadStatistics practice
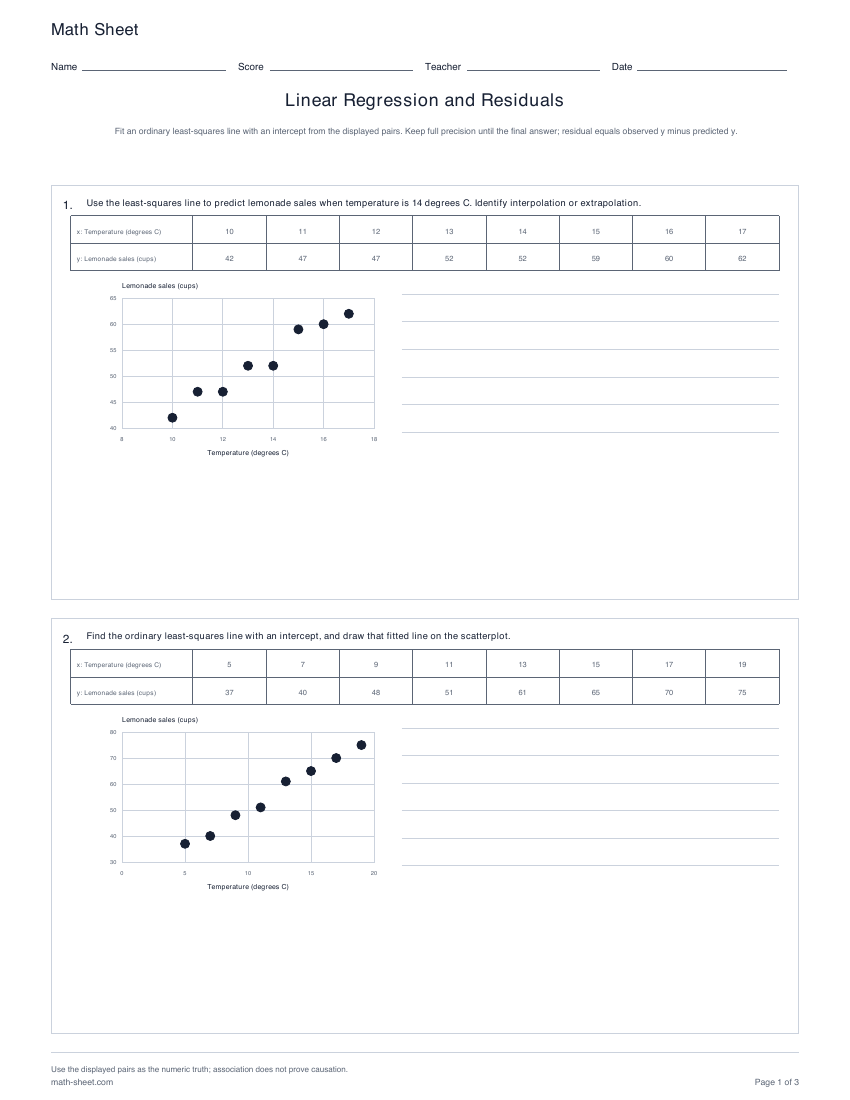
Fit ordinary least-squares lines with intercepts, predict responses, calculate observed-minus-predicted residuals, and identify extrapolation.
Ready-made English PDF · fixed settings
Customization below makes a separate PDF.
Fixed English ready-made files. Custom settings below apply only to the configured PDF.
Ready to print
Fit an ordinary least-squares line with an intercept from the displayed pairs. Keep full precision until the final answer; residual equals observed y minus predicted y.
Download the practice pages alone, or include a separate answer key or teacher model. Longer activities may use more than one page.
Customize this worksheetEvery plot and calculation comes from the labeled x and y table printed beside it. Construction tasks keep the student plot blank, while reading tasks provide the actual point cloud and worked keys complete each requested diagram.
Learning objective
Compute and interpret an OLS line from paired data, use it carefully for prediction, and calculate residuals with the correct sign.
Worked example
11 - (5 + 2(4)) = -2.
Residual is observed minus predicted, so a negative residual lies below the fitted line.
Teaching notes
Make it yours
Choose your options, update the preview, then download the exact same pages.
Choose paired-observation count, line-fitting/prediction/residual/interpretation tasks, and problem count. Keep the seed to reproduce the same worksheet.
A useful next step
Statistics
Construct and read labeled scatterplots from actual paired observations, calculate Pearson r, and interpret linear association without claiming causation.
Preview and download