
Probability
Probability with numbers worksheets
Find the chance of selecting a number from a finite set. Practice ranges up to 10, 25 or 50, count favorable outcomes and simplify the probability with an explained answer key.
Preview and downloadMake chance count
Build a clear picture of what can happen. Explore numbers, dice, cards and spinners, then move through counting, conditional probability, discrete counts and continuous distribution models with worked answers.
Choose a worksheetTwo fair dice. What is the chance of a sum of 7?
| + | 1 | 2 | 3 | 4 | 5 | 6 |
|---|---|---|---|---|---|---|
| 1 | 2 | 3 | 4 | 5 | 6 | 7 |
| 2 | 3 | 4 | 5 | 6 | 7 | 8 |
| 3 | 4 | 5 | 6 | 7 | 8 | 9 |
| 4 | 5 | 6 | 7 | 8 | 9 | 10 |
| 5 | 6 | 7 | 8 | 9 | 10 | 11 |
| 6 | 7 | 8 | 9 | 10 | 11 | 12 |
Check the experiment before choosing a sheet. The links open editable studios; query presets affect studio downloads, while each activity’s ready-made files retain its default edition.
| Task | Readiness check | Example | Worksheet |
|---|---|---|---|
| One equally likely outcome | Can the learner list the whole sample space? | Even on a fair die: 3/6 = 1/2. | Start with die faces → |
| Two ordered outcomes | Can the learner distinguish (2,5) from (5,2)? | Sum 7: six of 36 ordered pairs. | Use two dice → |
| Independent repeated draws | Is each card replaced and the deck shuffled? | Two aces with replacement: (4/52)² = 1/169. | Use replacement draws → |
| Conditional or joint events | Does “given” reduce the sample population? | After red from 4 red and 3 blue: P(next blue) = 3/6. | Use tables and no replacement → |
| Count before finding probability | Does order matter, and can items repeat? | A 3-person committee from 7 has 35 possible groups. | Choose a counting method → |
Describe, count, simplify
Count equally likely numbers, die faces and spinner sectors before writing a probability.
Probability
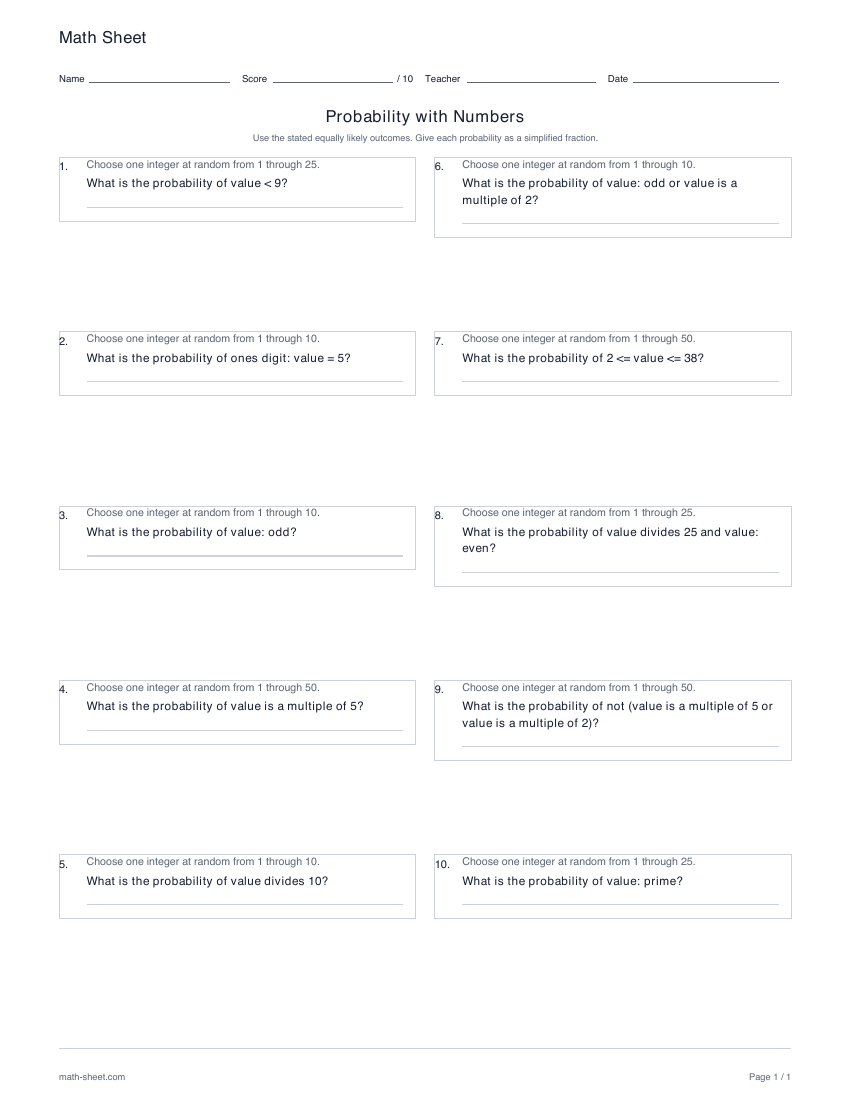
Find the chance of selecting a number from a finite set. Practice ranges up to 10, 25 or 50, count favorable outcomes and simplify the probability with an explained answer key.
Preview and download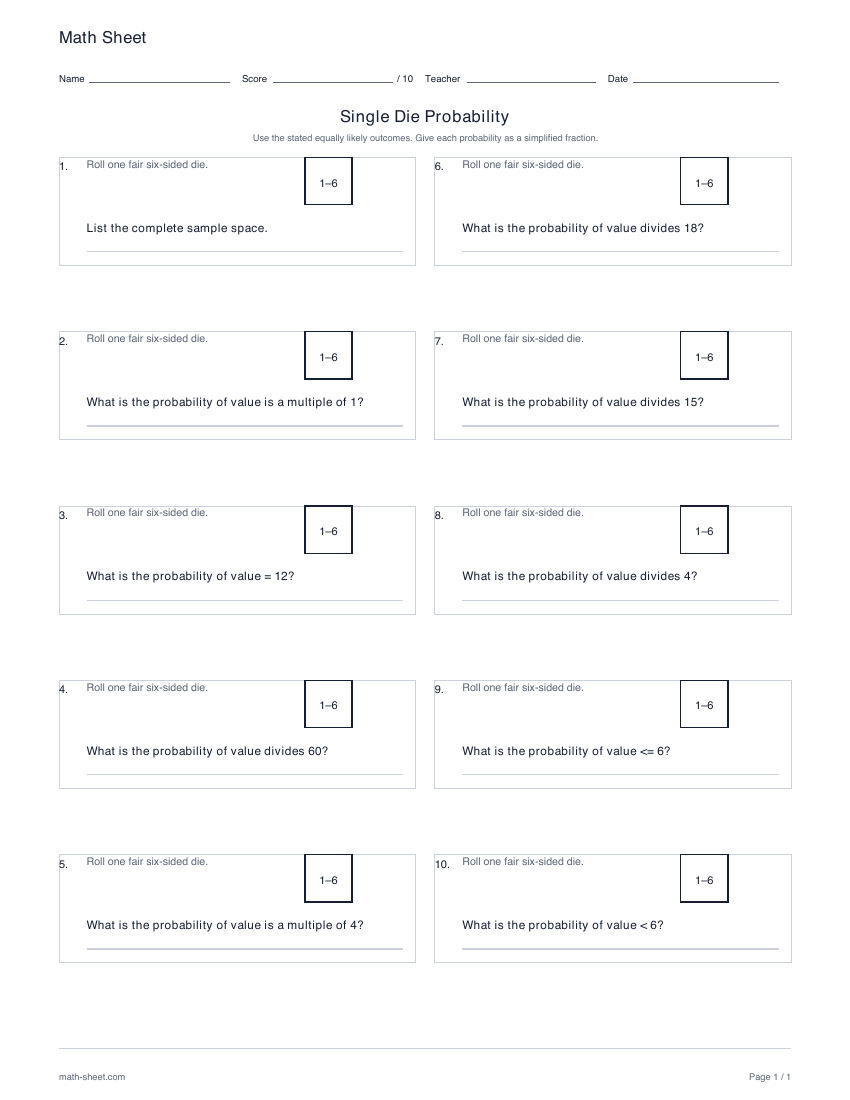
Probability
Explore six equally likely outcomes on a fair die. Choose number, multiple-and-divisor or factor questions, then print a worksheet and a separate explained answer key.
Preview and download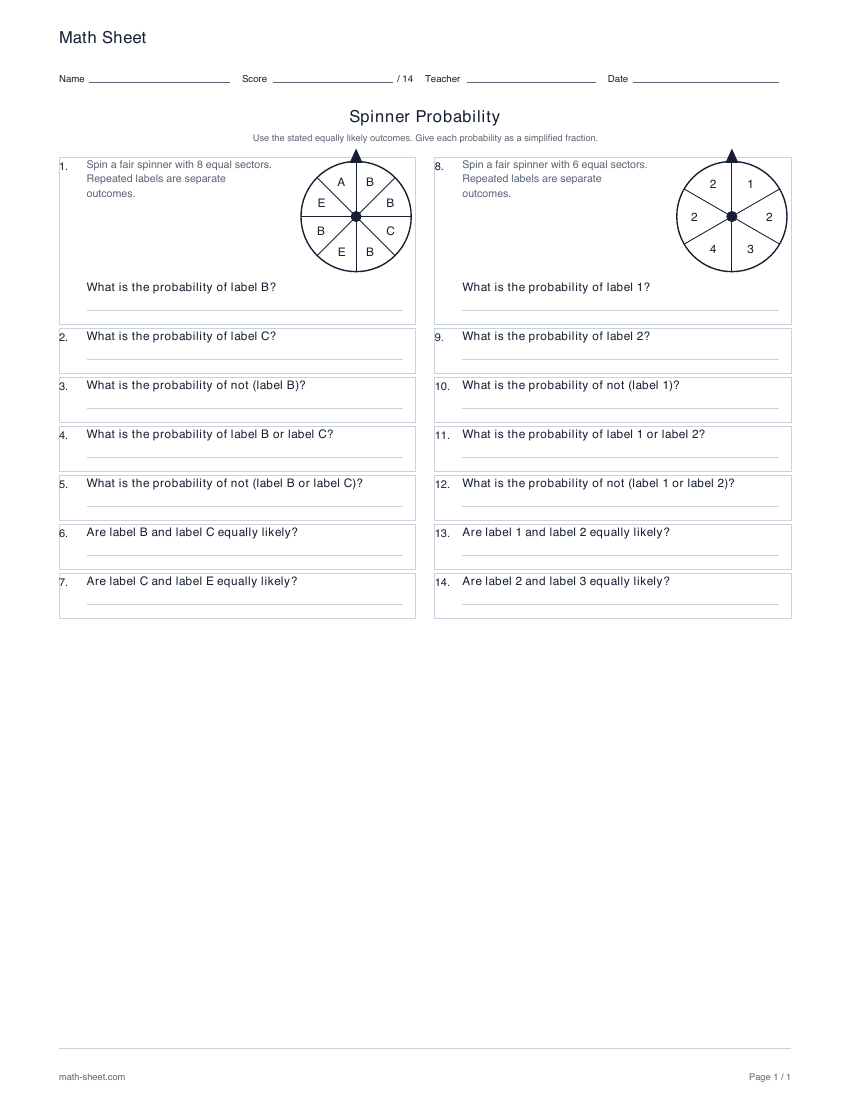
Probability
Read number and letter spinners with 5 to 12 equal sectors. Count matching sectors from the printed diagram and calculate simplified probabilities with an answer key.
Preview and downloadDescribe, count, simplify
Use ordered dice pairs and independent card draws to investigate more complex events.
Probability
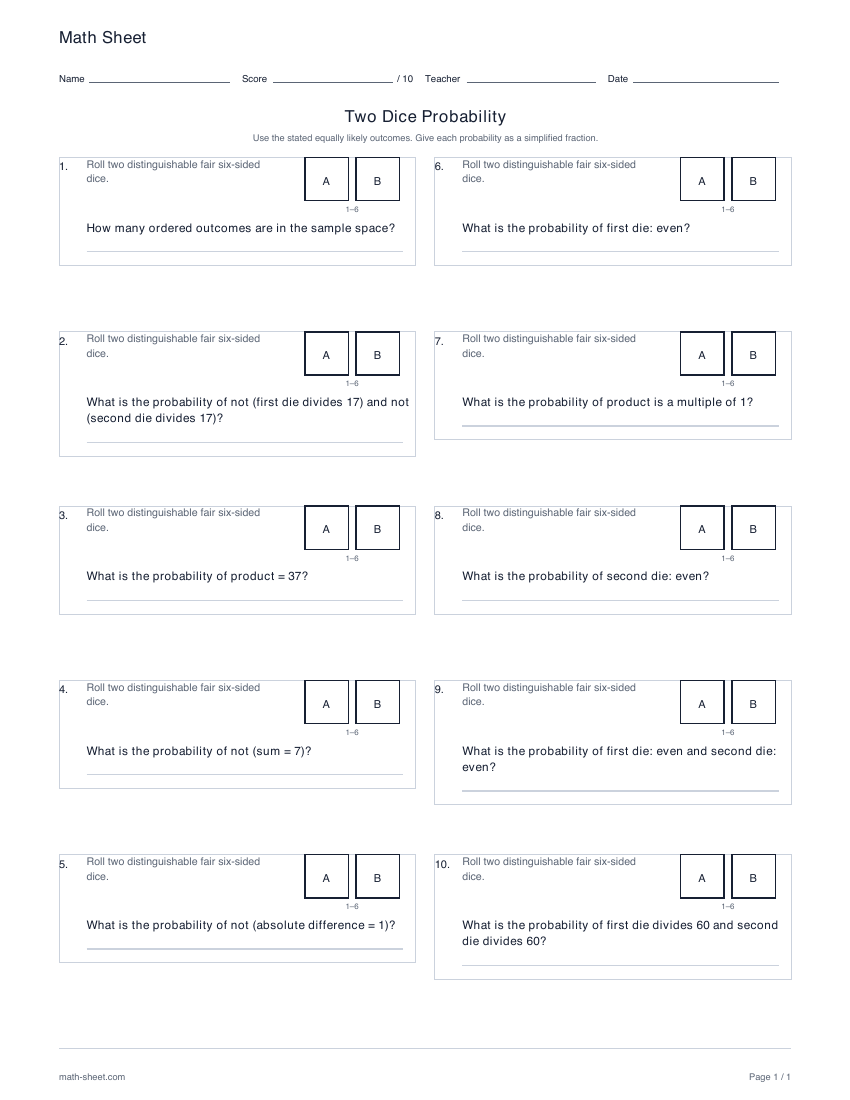
Count ordered outcomes from two fair dice. Practice number events, sums, differences, products and factor relationships with probabilities derived from all 36 possible pairs.
Preview and download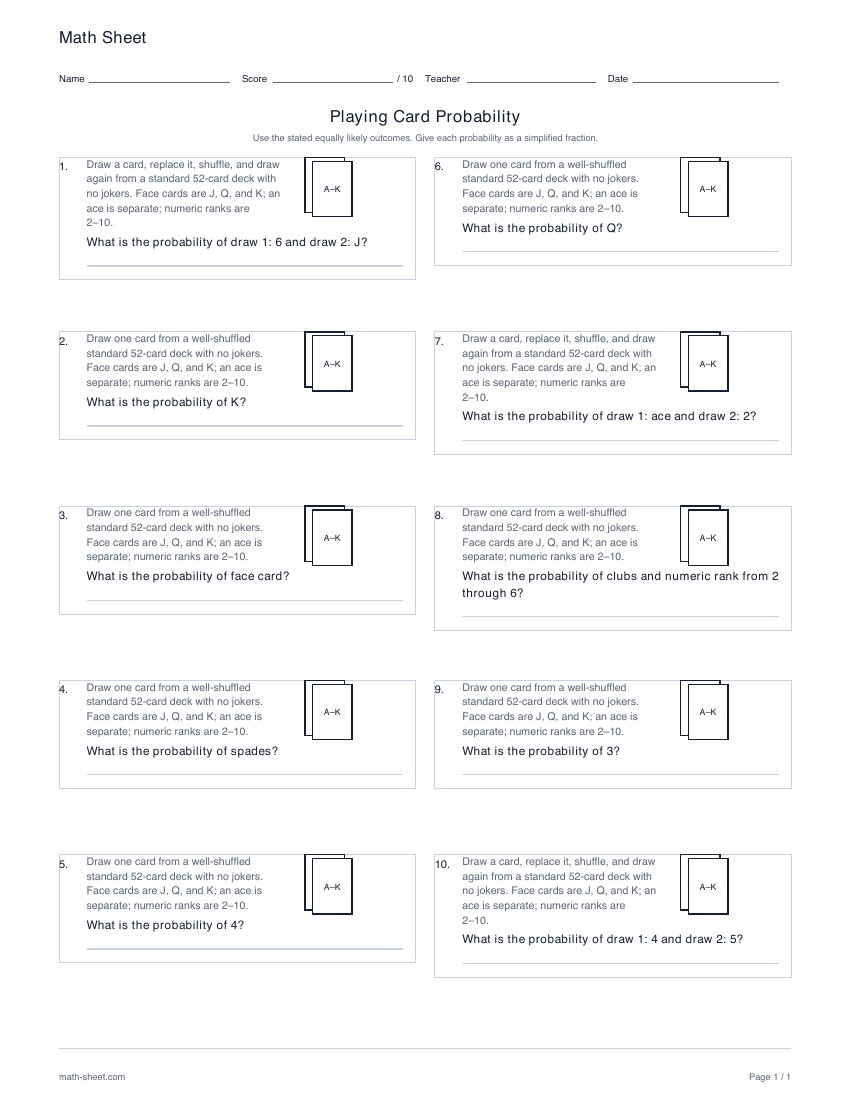
Probability
Calculate probabilities in a standard 52-card deck. Choose single draws or independent draws with replacement, with explicit card conventions and an explained answer key.
Preview and downloadDescribe, count, simplify
Connect definitions with independent events, conditional probabilities and a probability tree.
Probability
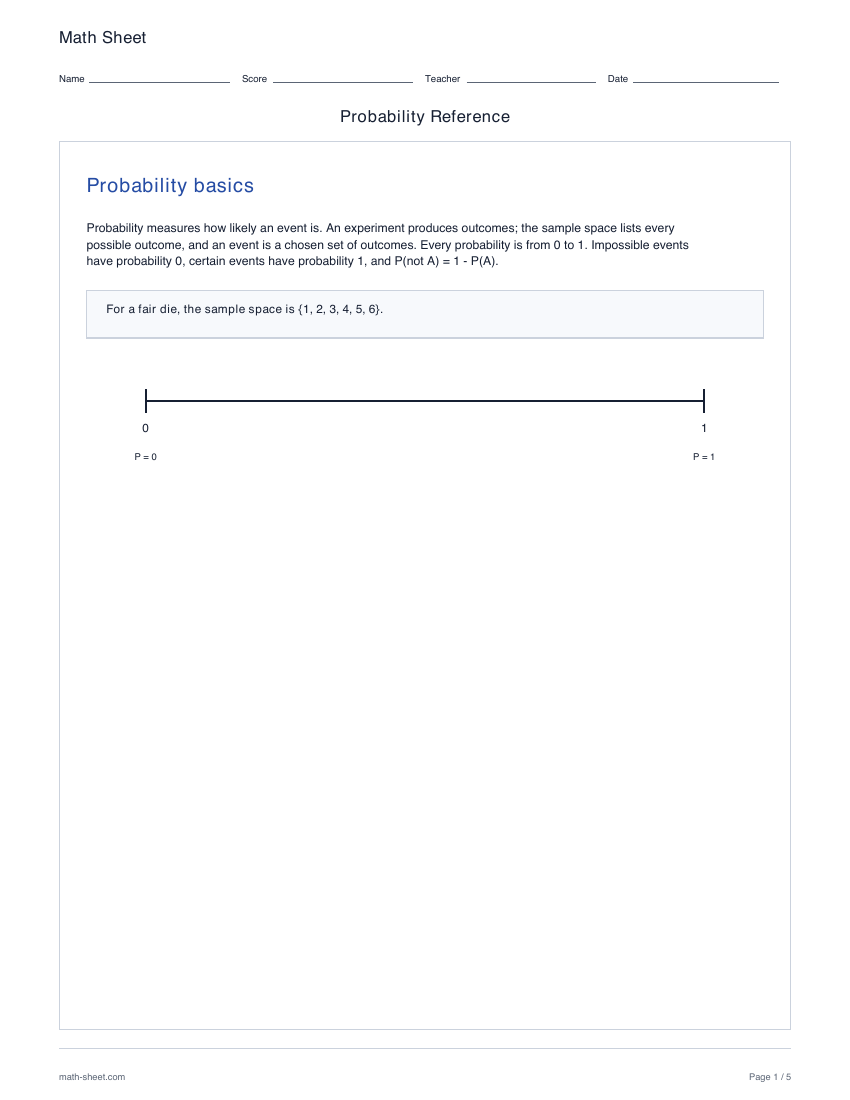
A printable guide to probability, independent and dependent events, replacement and probability trees. Connect definitions with worked examples and conditional branch probabilities.
Preview and downloadExtend the reasoning
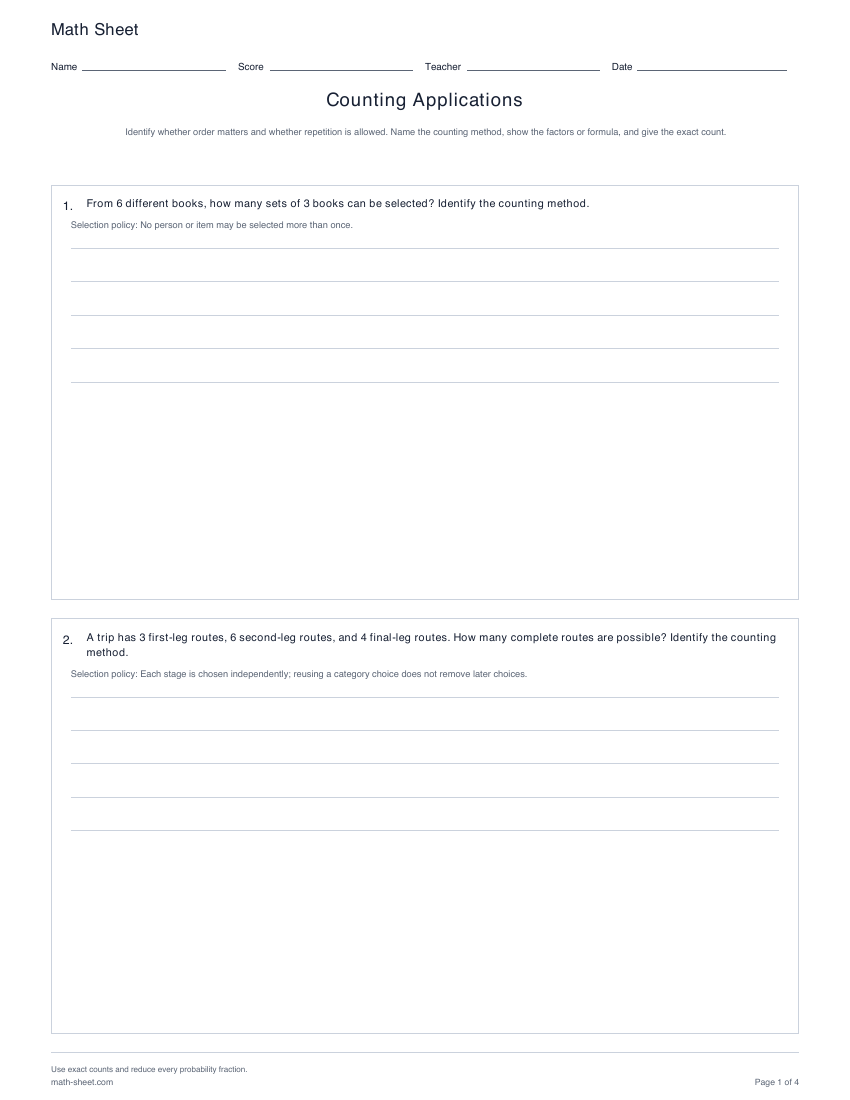
Choose the multiplication rule, permutations or combinations for a counting situation. Then use two-way tables and draws without replacement to distinguish a conditional probability from a joint event. These configurable worksheets include exact answers and worked steps.
Probability
Choose among the multiplication principle, ordered selections without replacement, and unordered combinations in varied finite contexts.
Preview and download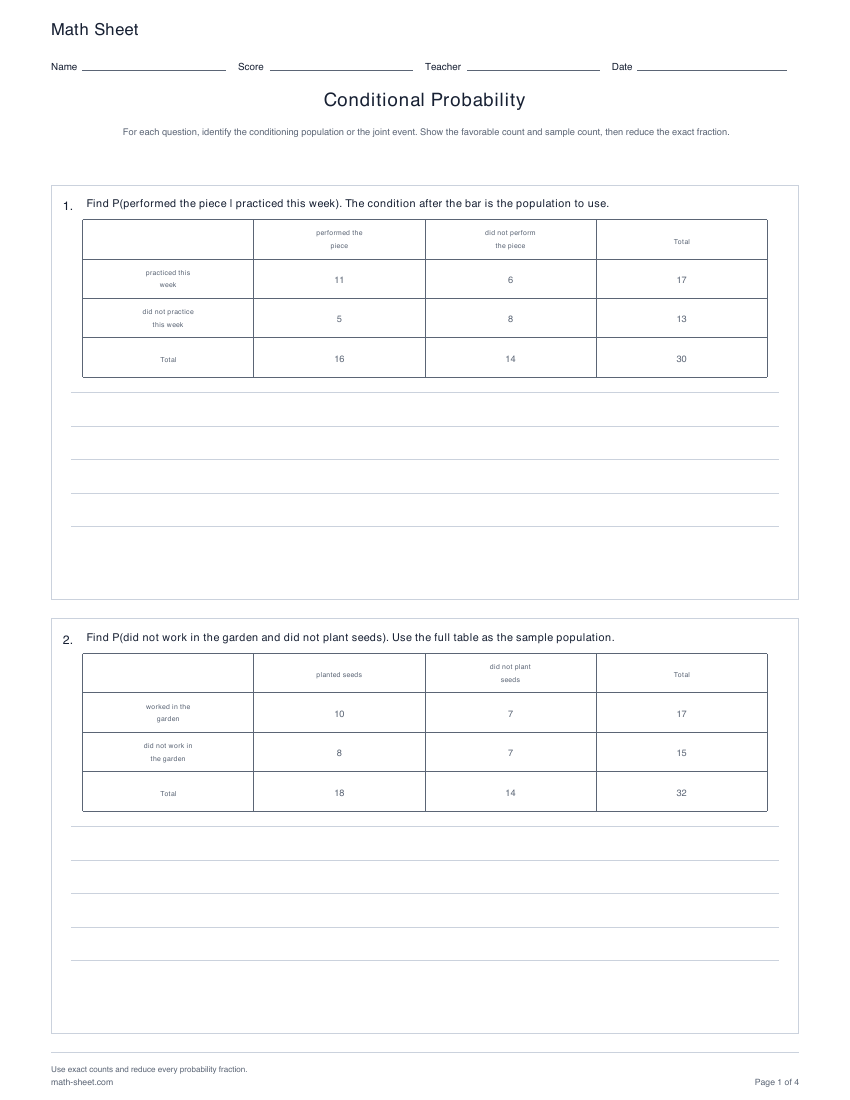
Probability
Compare conditional and joint probabilities using complete two-way count tables and two sequential draws without replacement.
Preview and downloadStart with equivalent fractions, percentages and basic algebra. Use counting and conditional probability before Bayes; use finite distribution tables before binomial and geometric models.
Move from discrete counts to continuous density, area and waiting-time models. Choose the assumptions before calculating. Statistical inference is a separate stage of the learning path.
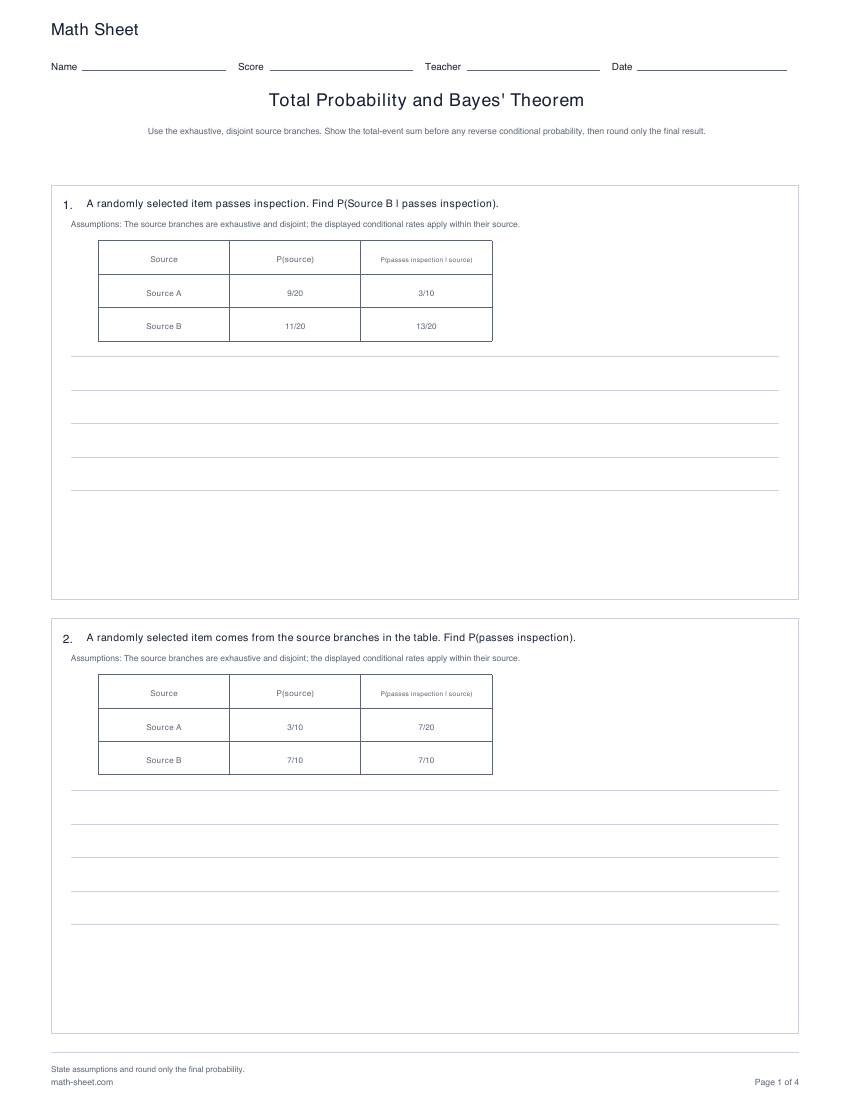
Use exhaustive, disjoint source groups. Multiply along each path, add the event paths, then divide the matching joint probability by the total event probability.
Probability
Practice forward total probability and reverse conditional probability with explicit two- and three-source partitions.
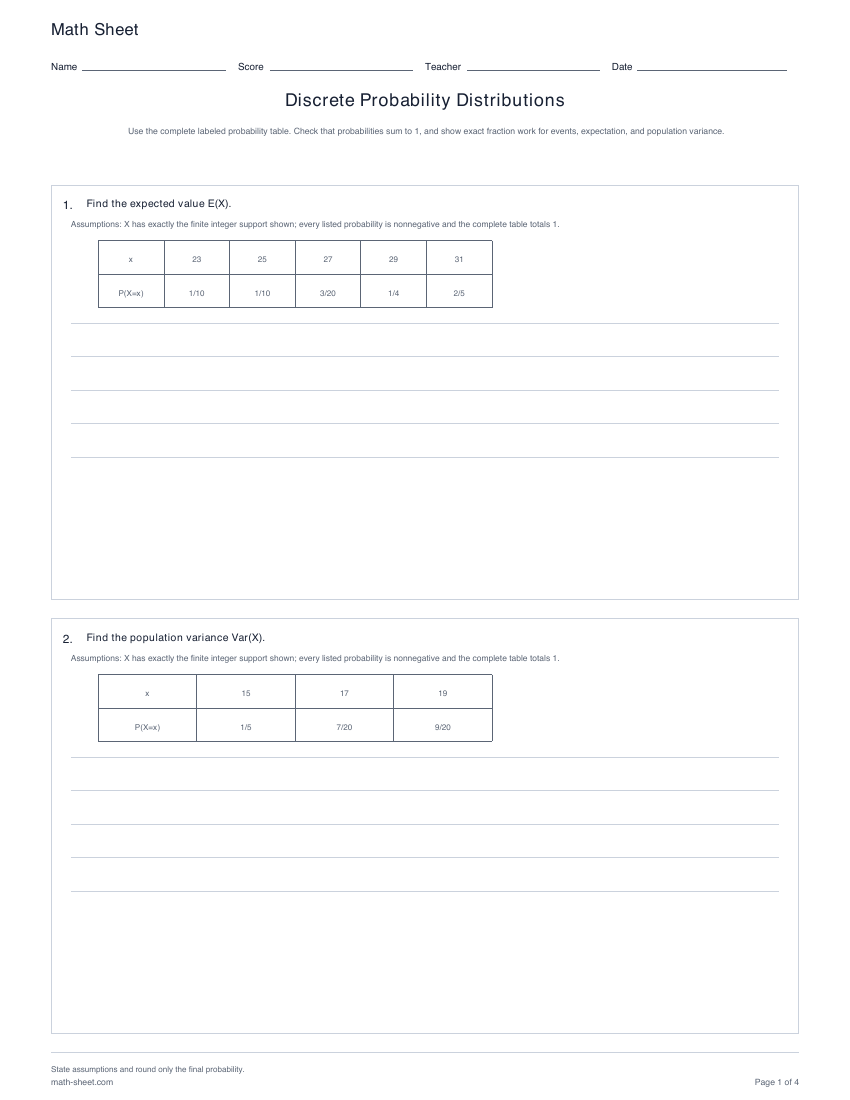
Preview and downloadCheck that probabilities sum to one. Find missing probabilities, then use weighted sums for expectation and population variance.
Probability
Use valid finite probability tables to find missing entries, event probabilities, expected value, and population variance.
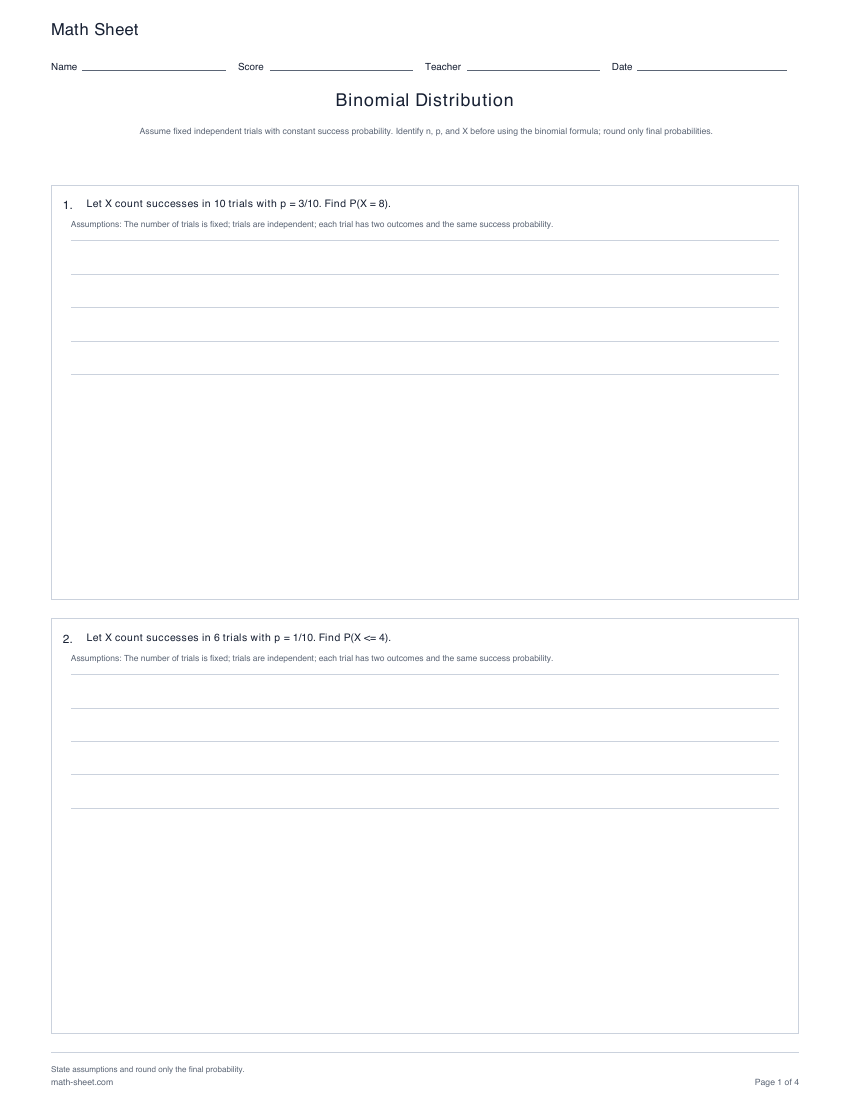
Preview and downloadBinomial counts successes in a fixed number of independent trials. Geometric counts trials through the first success. Both require a constant success probability.
Probability
Calculate exact, at-most, and at-least binomial probabilities plus mean and variance for bounded trial counts.
Preview and download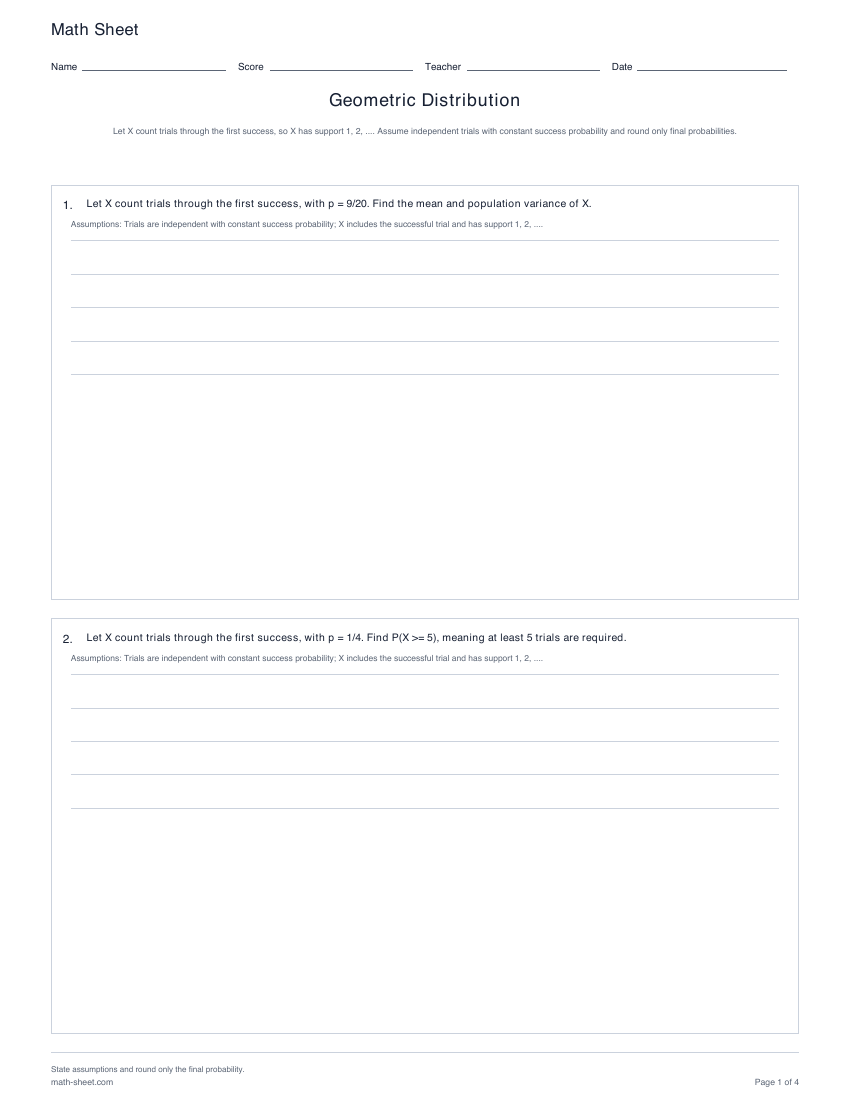
Probability
Model the number of trials through the first success using exact, cumulative, tail, mean, and variance questions.
Preview and downloadA density height is not a probability. Integrate over an interval, keep the complete support visible and use the CDF to connect areas to cutoffs.
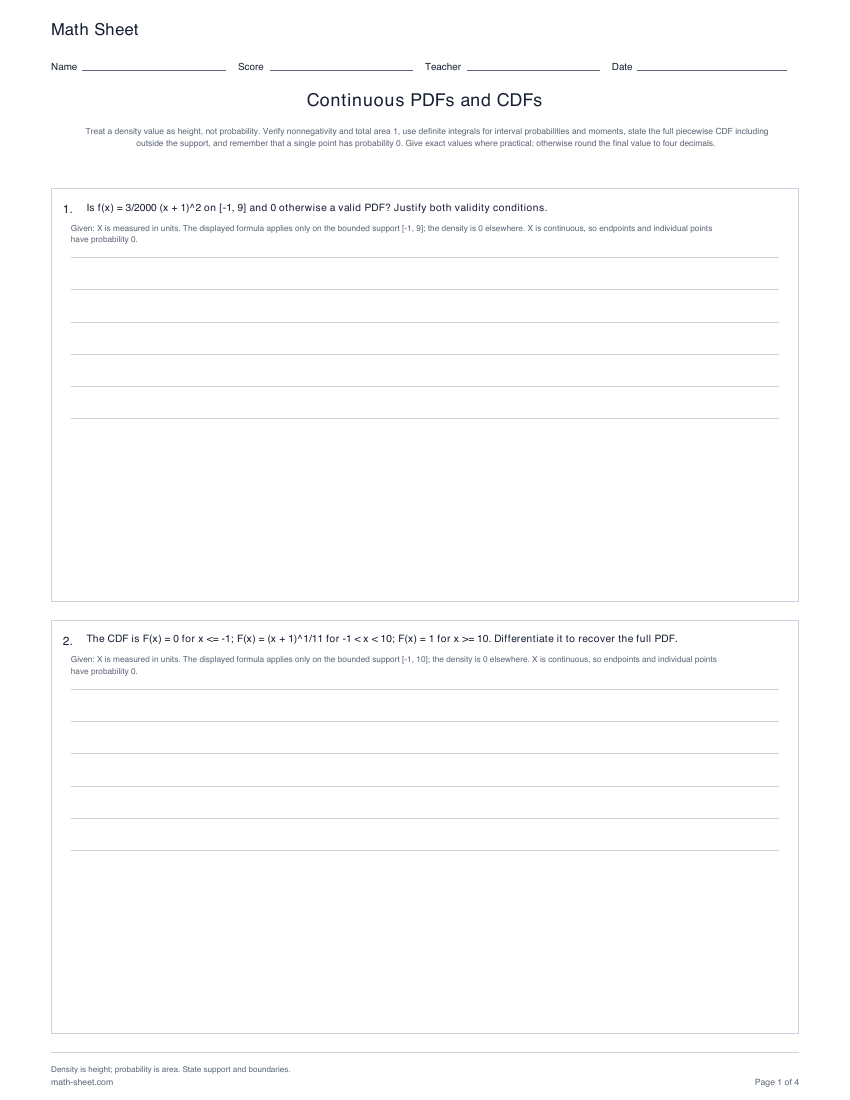
Probability
Normalize bounded polynomial densities, integrate probabilities and moments, build piecewise CDFs, recover PDFs, and invert CDFs for quantiles.
Preview and download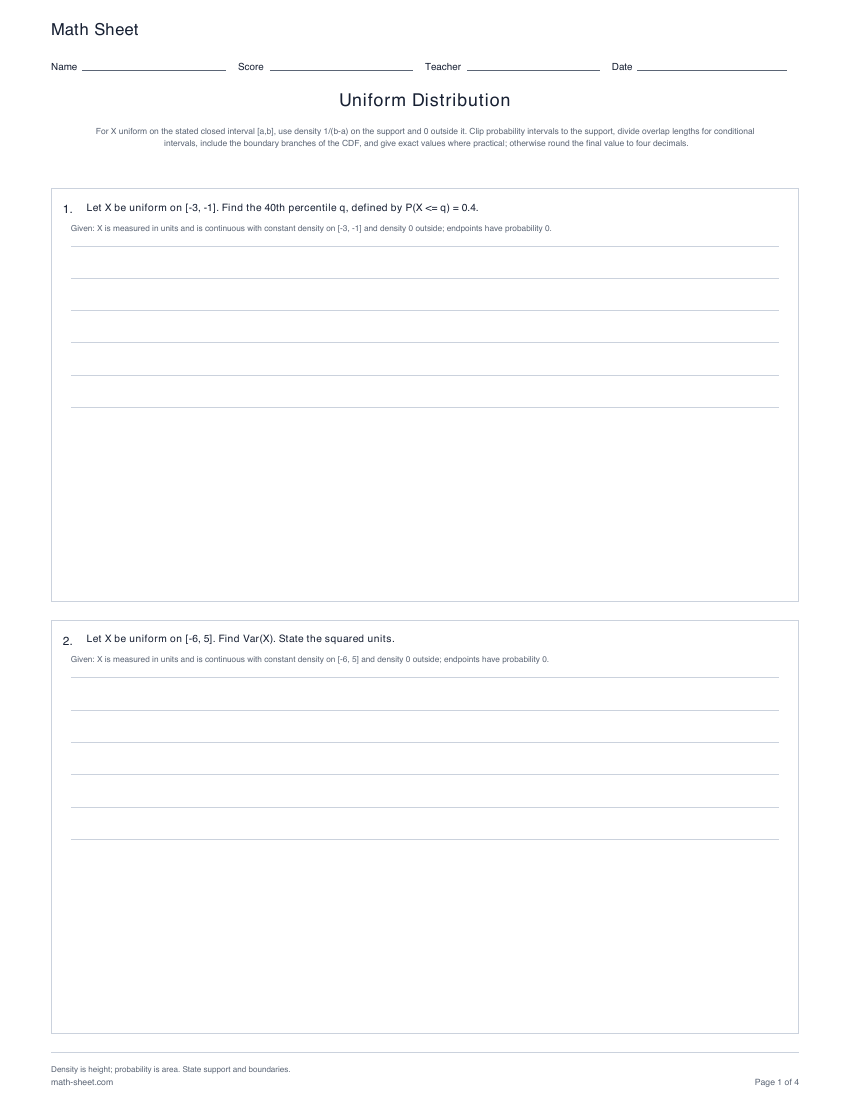
Probability
Use support length for density, clipped interval and conditional probabilities, piecewise CDFs, quantiles, mean, and variance.
Preview and downloadUse Poisson for counts in a stated exposure interval and exponential for a waiting time under a constant-rate model. Track the units when converting a rate or mean.
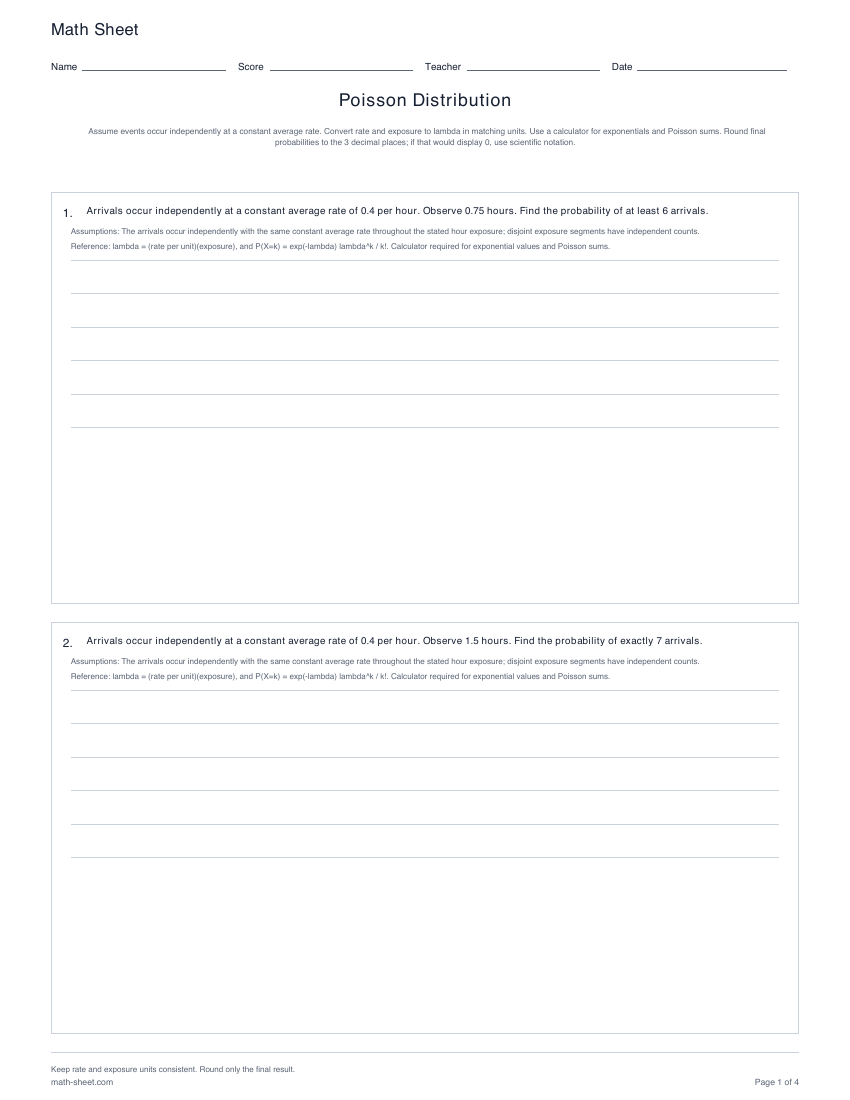
Probability
Scale a constant event rate to an exposure, then calculate exact, cumulative, tail, mean, and variance results for Poisson counts.
Preview and download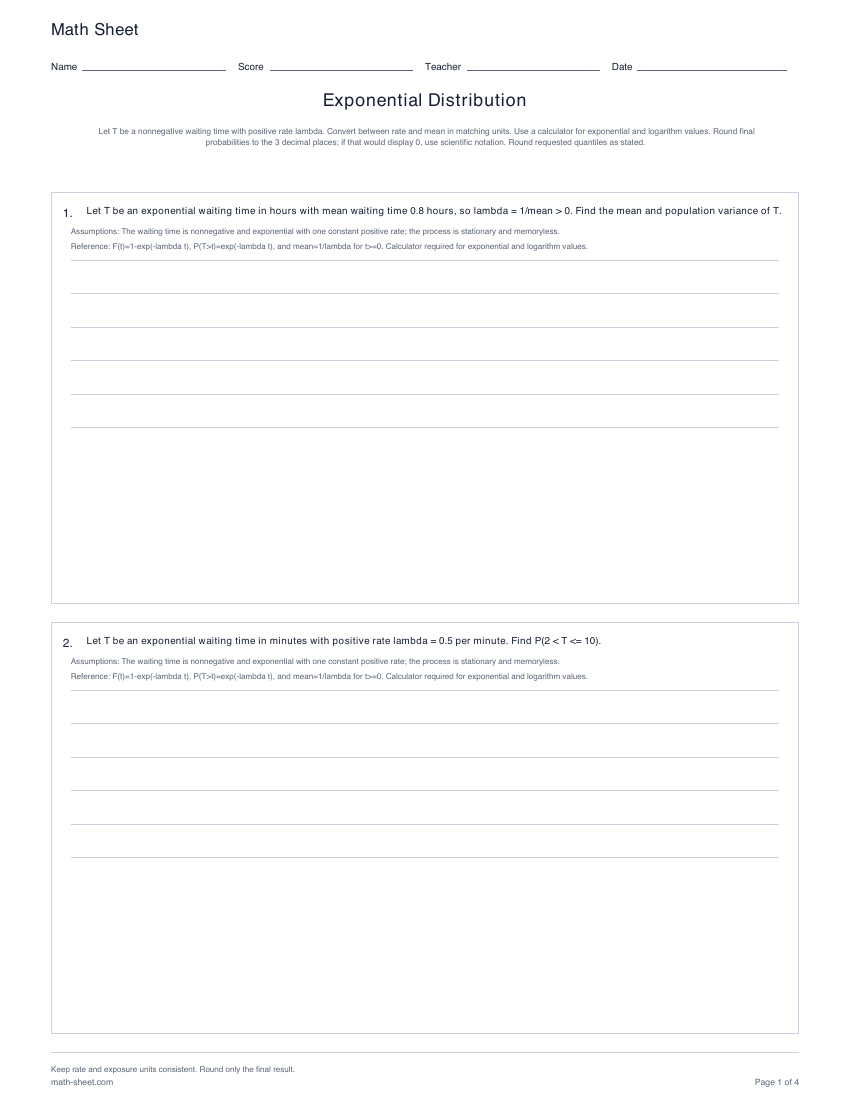
Probability
Work with exponential waiting-time CDFs, survival probabilities, intervals, quantiles, moments, rate-mean conversion, and memorylessness.
Preview and downloadRead joint tables and densities, derive marginal and conditional distributions, and check independence before using covariance or a sum rule.
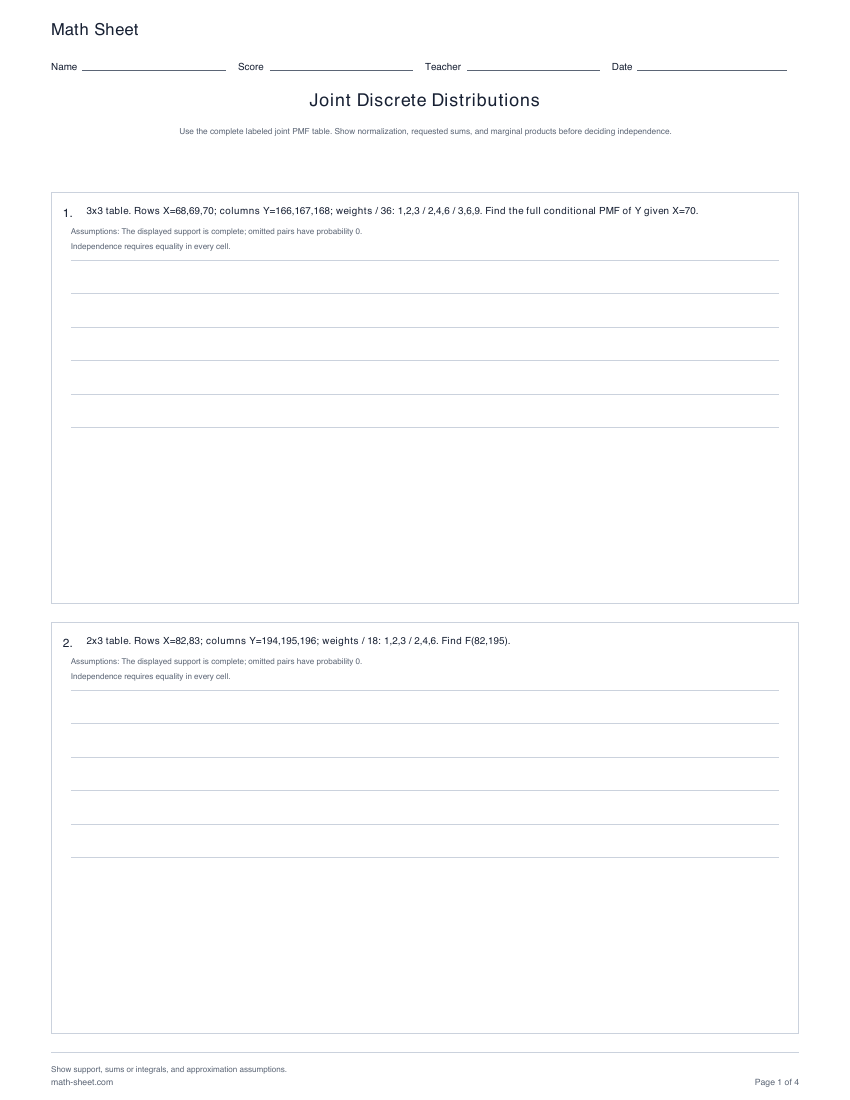
Probability
Use numeric joint PMF tables for CDFs, events, marginals, conditionals, moments, and independence.
Preview and download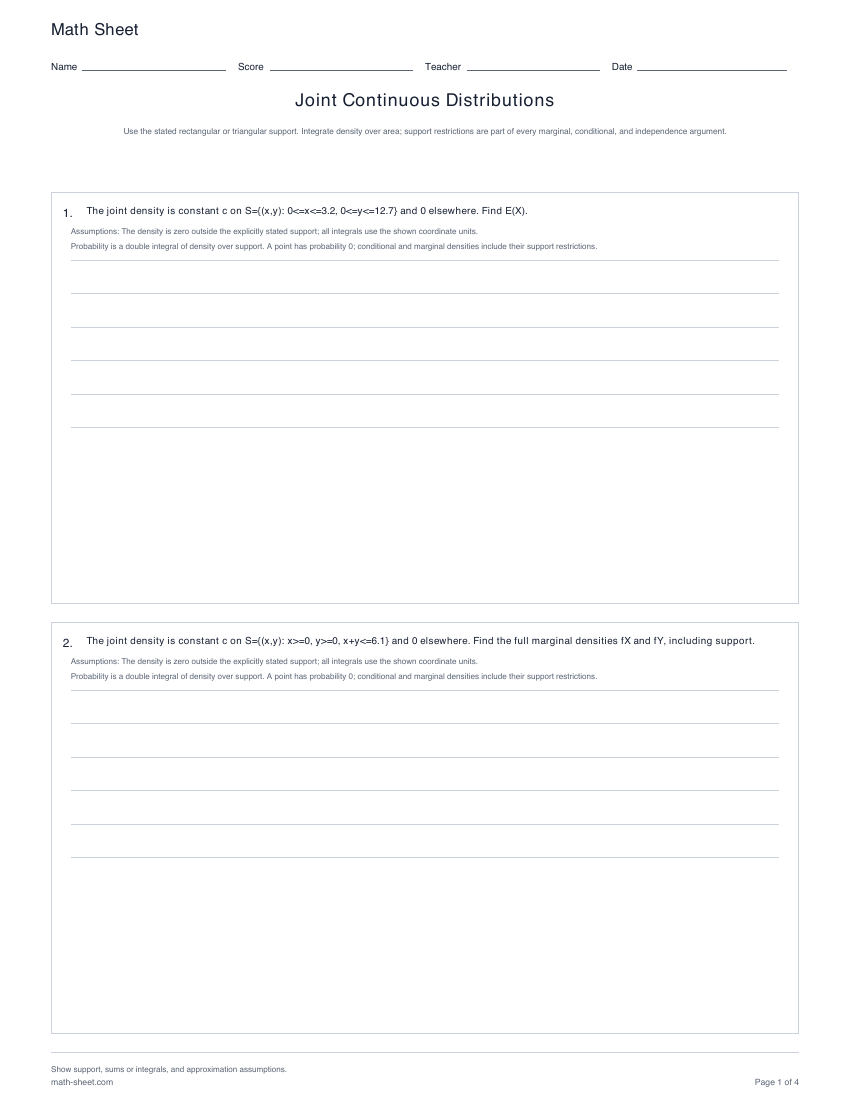
Probability
Integrate densities on rectangular and triangular supports for probabilities, CDFs, marginals, conditionals, and independence.
Preview and download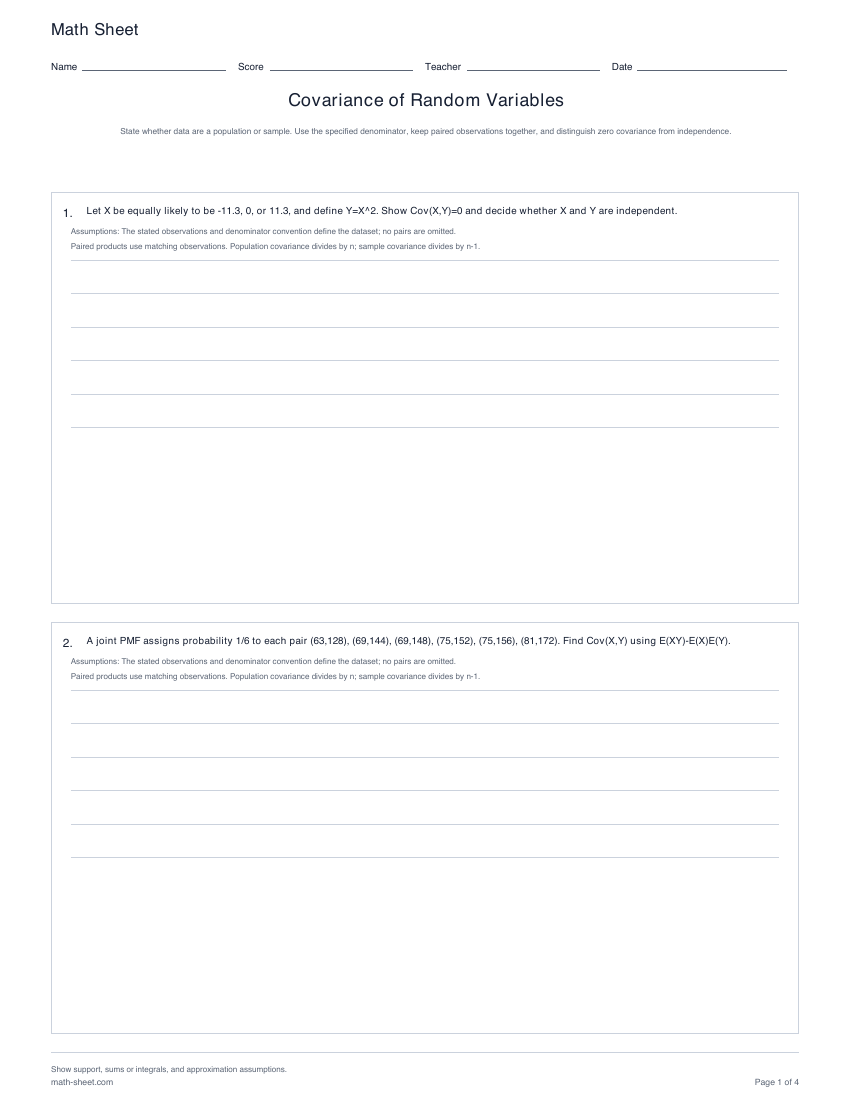
Probability
Calculate covariance and correlation from joint PMFs or paired data with explicit denominators.
Preview and downloadDensity histograms use area, not height, for probability. Distinguish convergence of averages from an approximate normal sampling distribution and state every assumption.
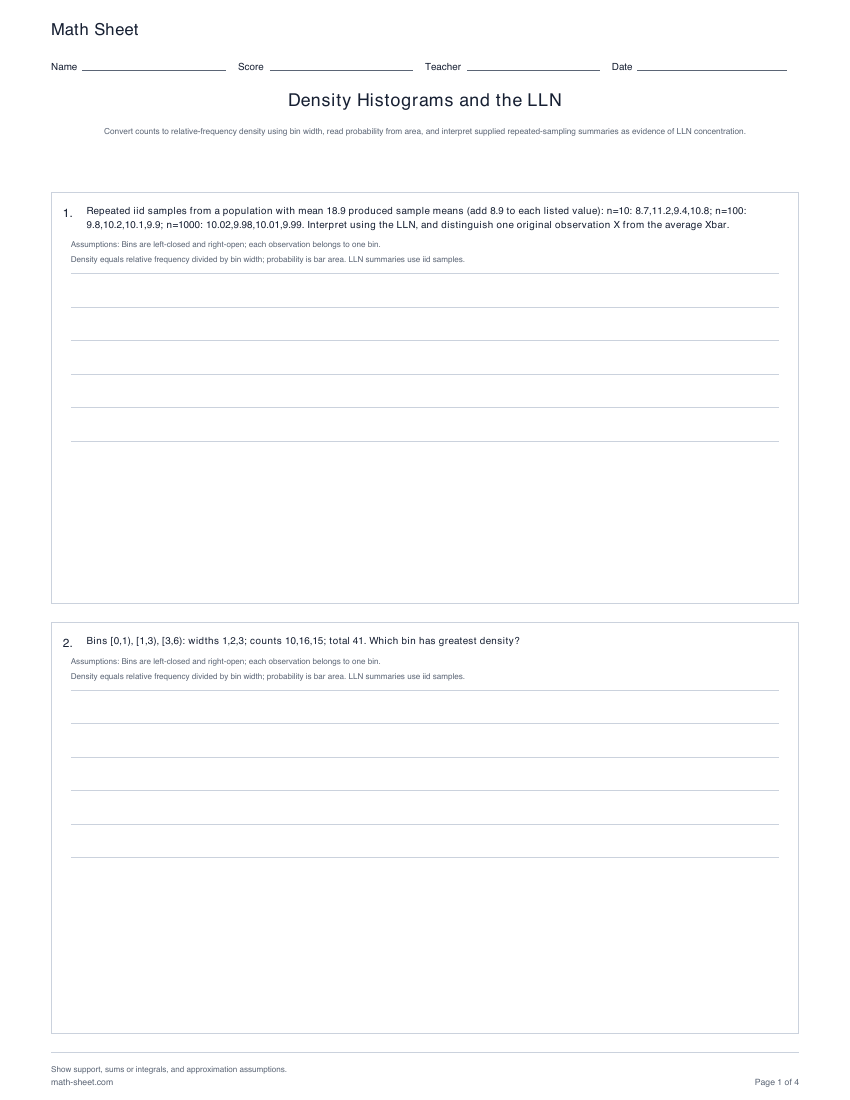
Probability
Convert unequal-width bin counts to density and area, then interpret supplied repeated-sampling summaries.
Preview and download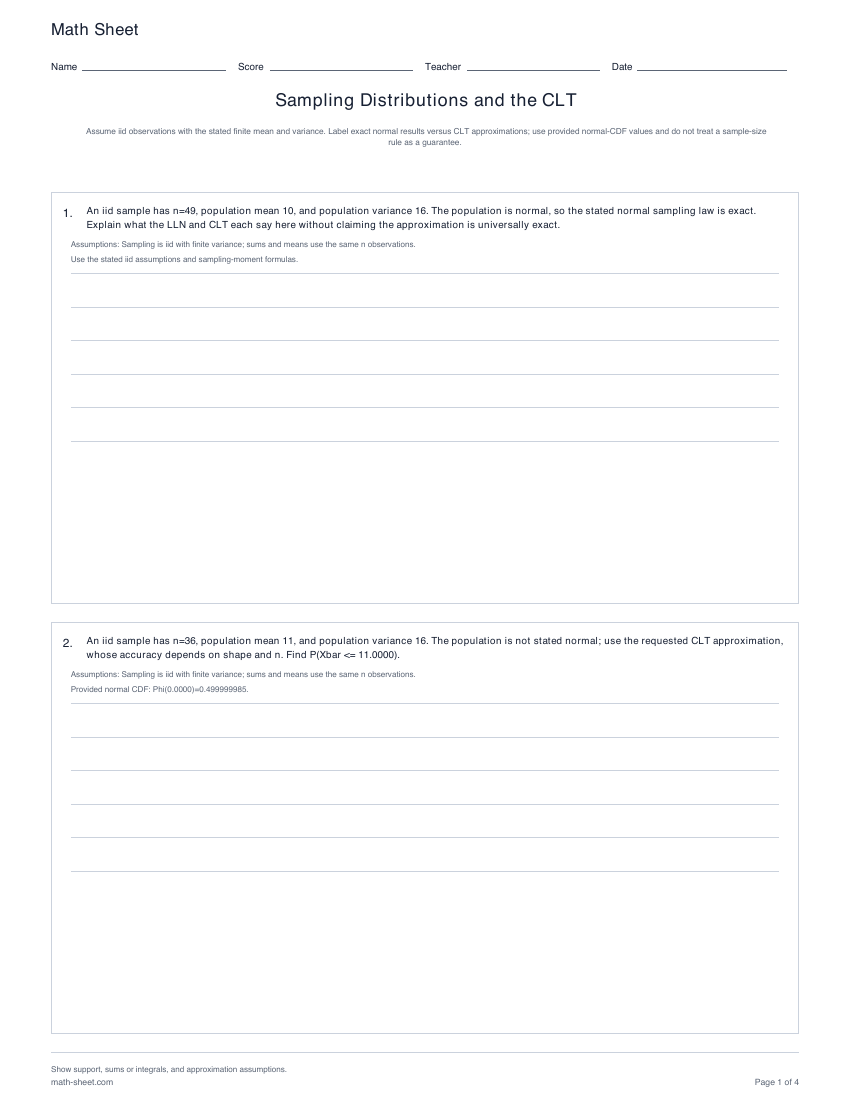
Probability
Find moments and probabilities for means and sums, distinguish exact normal results from CLT approximations, and use continuity correction.
Preview and downloadRecover overlaps before counting a union, use a complement for collisions and compare joint probabilities with the product rule for independence.
Probability
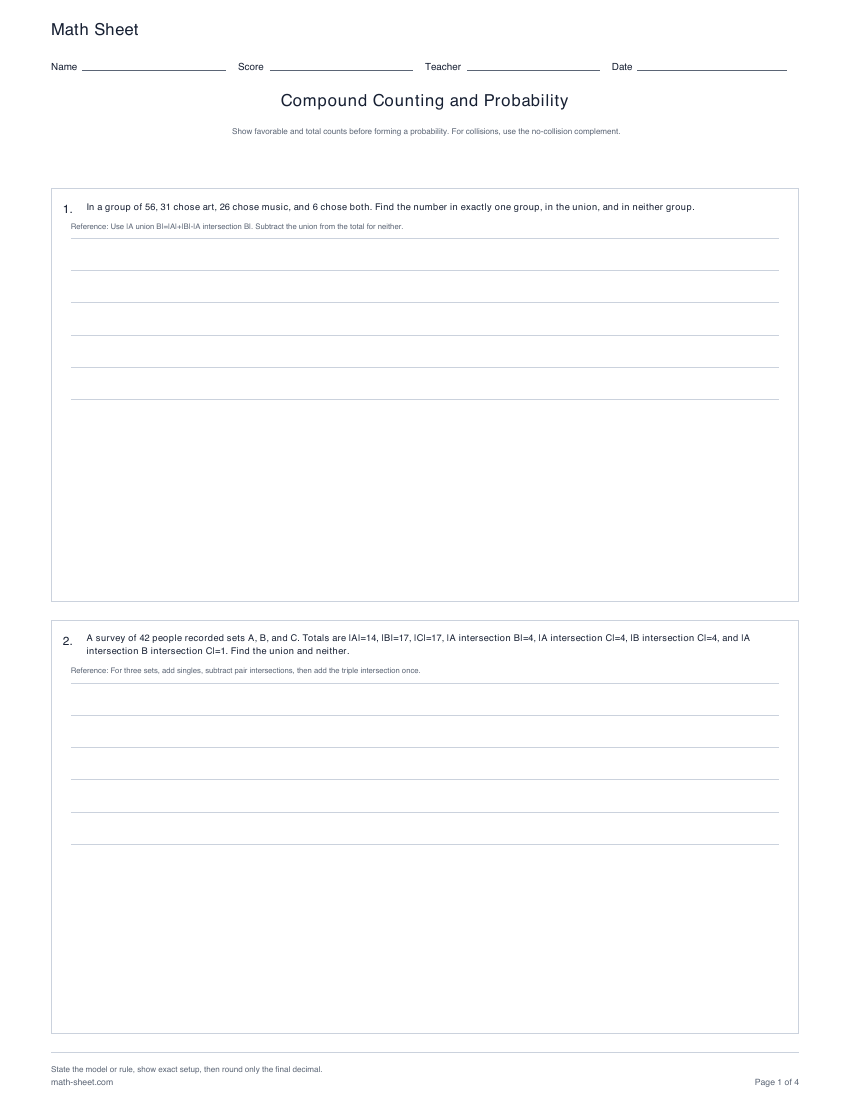
Reconstruct two- and three-set totals, count compound outcomes, and calculate collision probabilities by complements.
Preview and download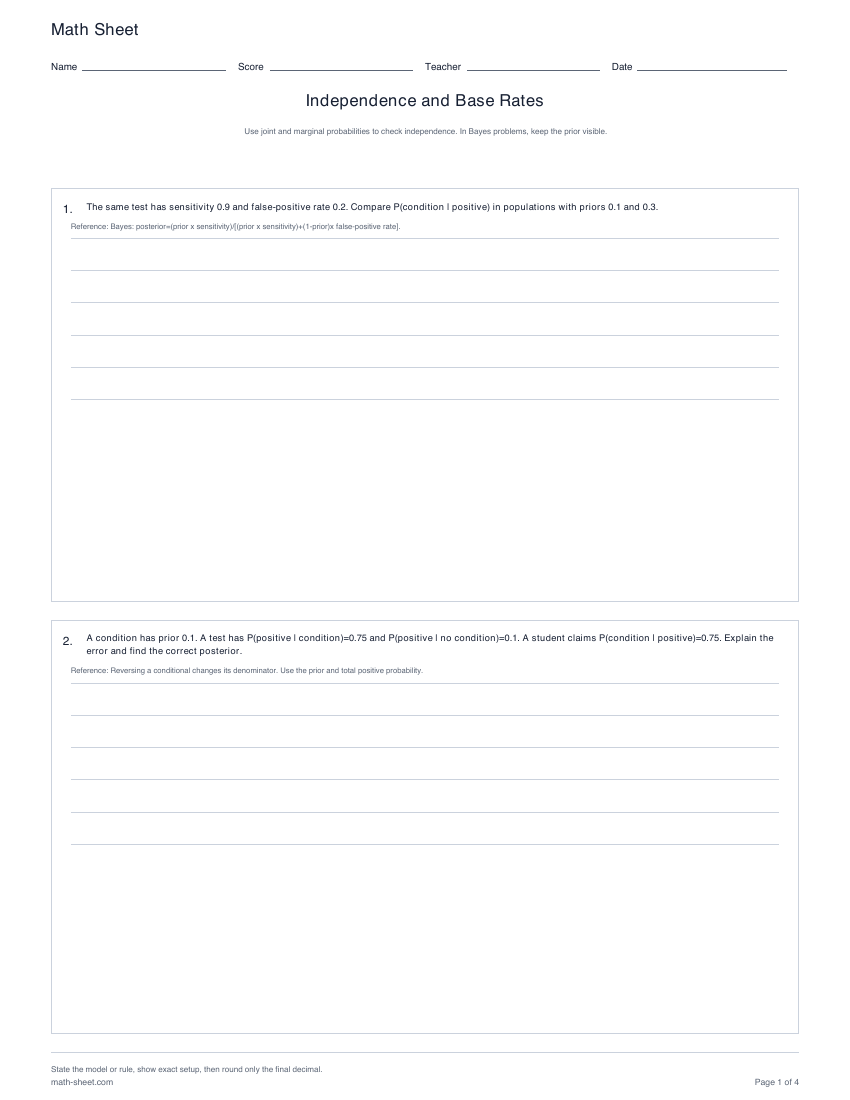
Probability
Check independence in rational tables and compare Bayesian posteriors under different priors.
Preview and downloadA transformed variable needs a new support and distribution. Aggregate repeated discrete values and include every continuous preimage before differentiating a CDF.
Probability
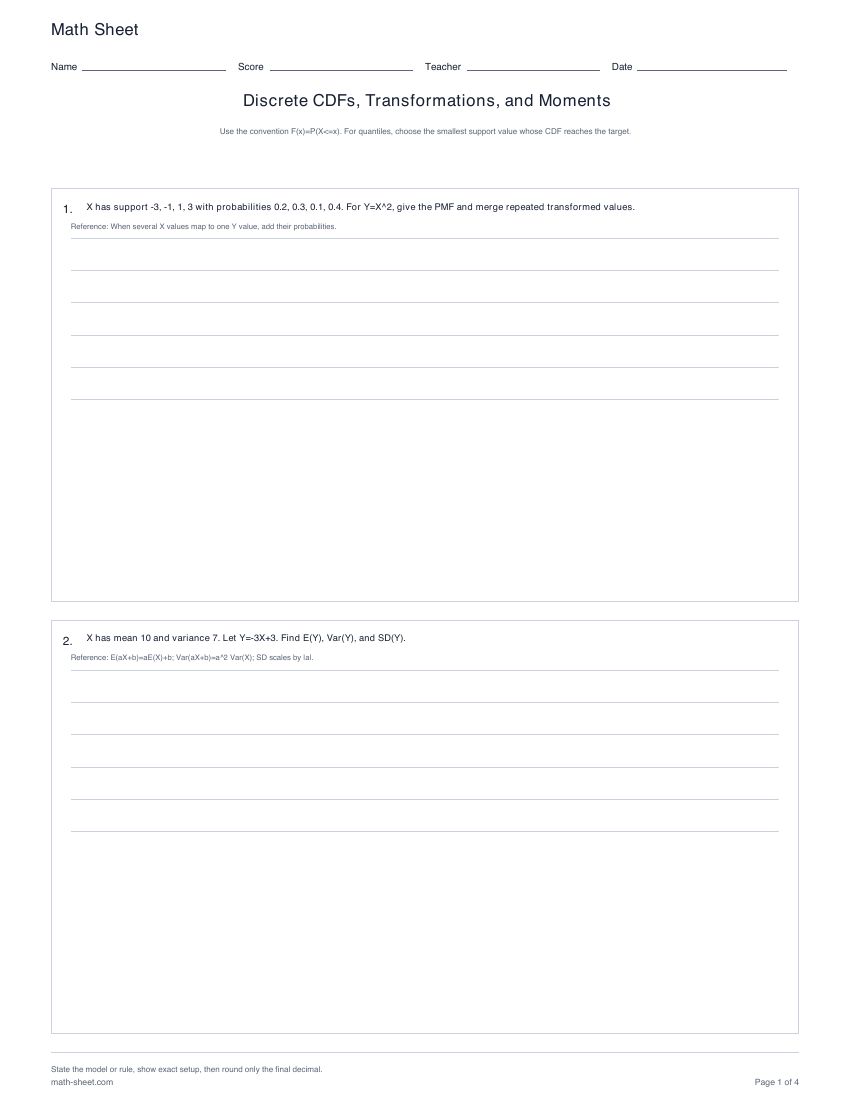
Build step CDFs, find quantiles, merge transformed PMFs, and apply weighted moment rules.
Preview and download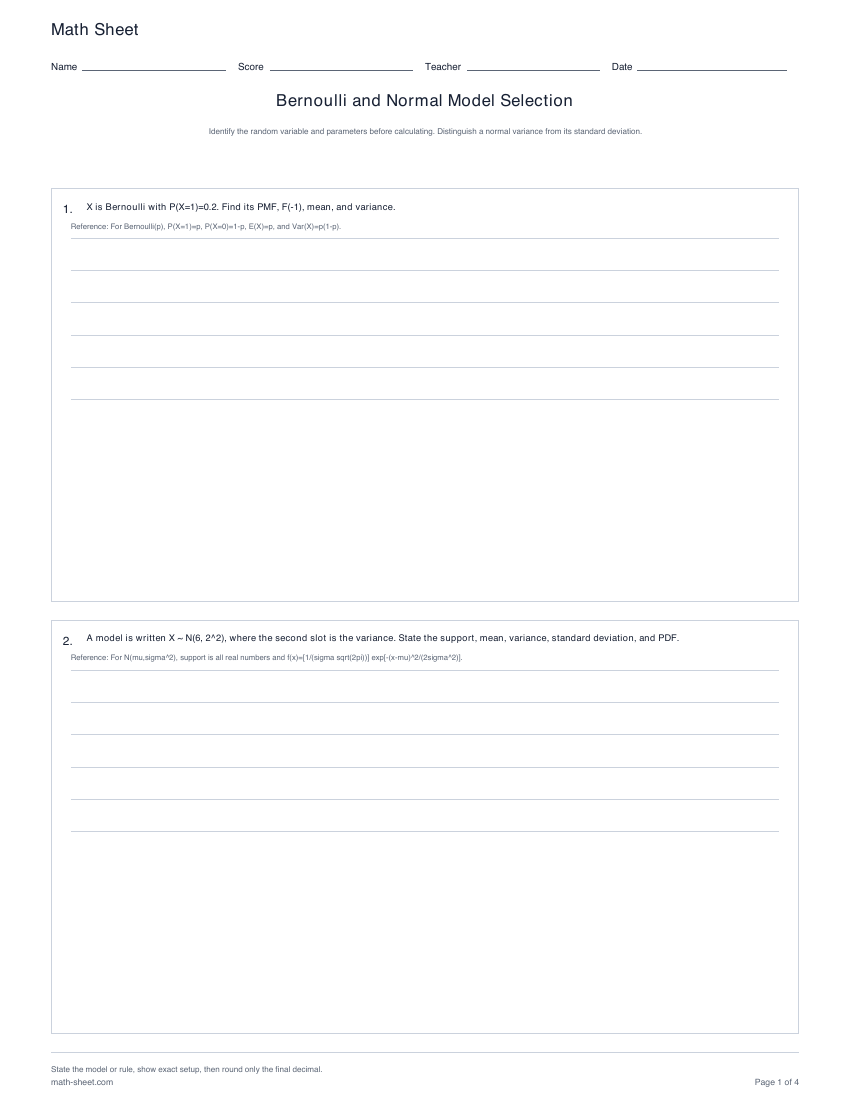
Probability
Distinguish Bernoulli from binomial counts and identify normal support, PDF parameters, variance, and standard deviation.
Preview and download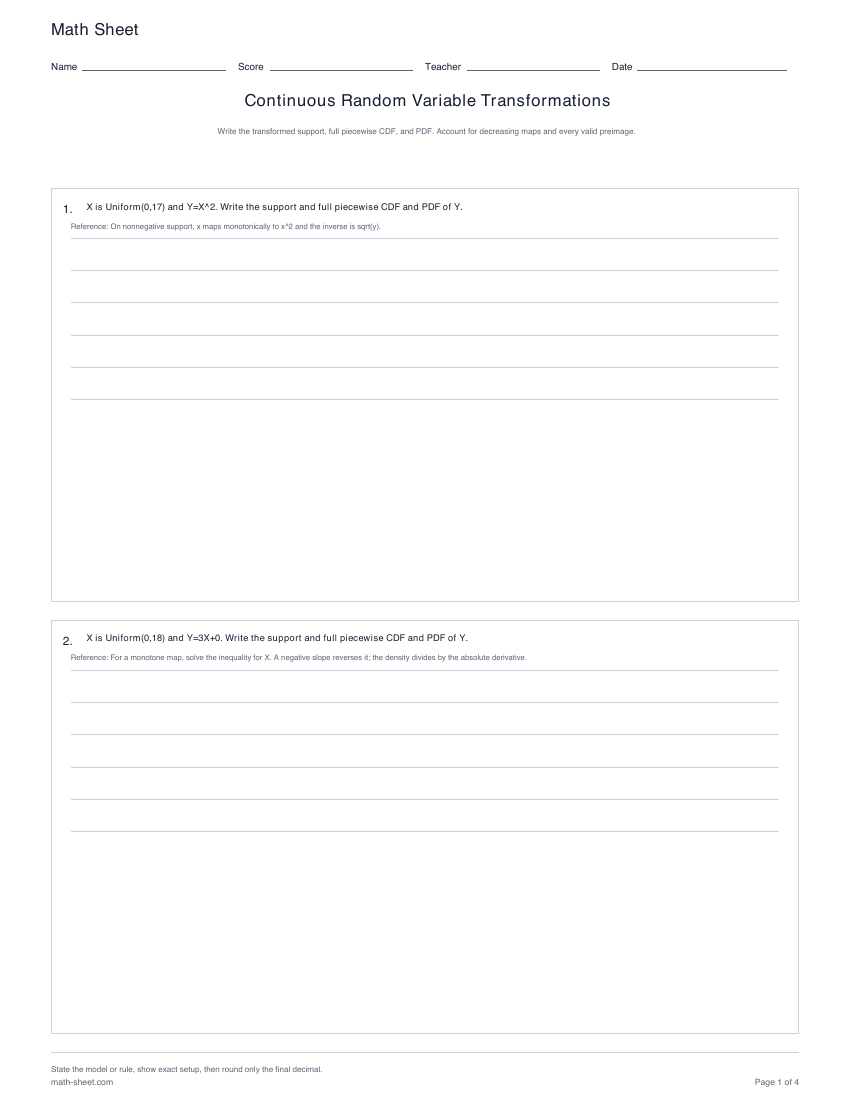
Probability
Transform supports, CDFs, and PDFs for affine, square, square-root, and two-preimage mappings.
Preview and downloadThese editable selections combine complete worksheets. Remove or reorder resources to match your learner, then choose Letter or A4 and student or teacher editions.
Begin with simple sample spaces, then count combinations and distinguish conditional from joint events.
Edit this packet →Review conditional probability, work through Bayes and finite distributions, then compare binomial and geometric models.
Edit this packet →Collect six complete worksheets for review. Each worksheet retains its own instructions and worked answer pages.
Edit this packet →Connect density and cumulative probability with uniform, exponential and normal models. Each worksheet has its own worked answer pages.
Edit this packet →Compare binomial and Poisson counts with geometric and exponential waiting models. State the assumptions and units for each.
Edit this packet →Move from joint tables and densities to covariance, density histograms and the sampling distribution of a mean.
Edit this packet →Connect compound counting and independence with model selection, discrete CDFs and continuous transformations.
Edit this packet →For a fair six-sided die, the possible results are 1 through 6. Three are even, so the probability of an even result is 3/6 = 1/2. This count-based method works because all six faces have the same chance.
The same idea applies to a uniformly chosen integer or a fair spinner divided into equal sectors. State that assumption before counting. A spinner with unequal sectors would require the sector sizes, not just their labels.
Greater than 4 excludes 4; at least 4 includes it. An event using “and” requires both conditions to hold. An event using “or” includes outcomes satisfying either condition, counting overlap once.
For a number chosen from 1 through 10, “even or a multiple of 3” matches 2, 3, 4, 6, 8, 9 and 10. There are seven outcomes, because 6 meets both conditions but is counted only once.
There are 36 ordered pairs when two fair six-sided dice are rolled independently. The outcomes (2,5) and (5,2) are different: the first and second dice show different values in the two cases.
Adding the values groups these outcomes into sums. Some sums collect more pairs than others. The sum 7 has six pairs, while the sum 12 has only (6,6). A table makes that difference visible.
After a card is drawn, replacing it and shuffling restores the original deck. The chance of an ace on the next draw is again 4/52. For an ordered independent sequence, multiply the probabilities for the required events.
Without replacement, the second chance depends on the first result. The conditional-probability worksheet provides generated bag problems without replacement and two-way count tables. The reference handout adds a probability-tree explanation; the existing card worksheet practices single draws and two draws with replacement.
Choose by readiness
Start with six die faces and readable spinner labels. Move to factors, ordered pairs and fraction multiplication when learners are ready. The Grade 4–6 entry points below are prerequisite-based suggestions, not claims of curriculum alignment.
Use familiar numbers and six equally likely outcomes as a first probability model.
Open this starting point →Compare repeated labels by counting sectors in two printed diagrams.
Open this starting point →Work from the integers 1 through 10 and justify which satisfy each event.
Open this starting point →Compare sums and absolute differences using two distinguishable dice.
Open this starting point →Replace and shuffle after the first draw, then multiply the event probabilities.
Open this starting point →Use the introductory sections first; explore conditional probability and trees when ready.
Open this starting point →A theoretical probability does not promise an exact result in a short run. Ten fair coin tosses can produce more or fewer than five heads. Record the actual outcomes and compare their relative frequencies with the theoretical model.
Ask what assumptions the model makes and whether the experiment follows them. A weighted die, an uneven spinner or a deck missing cards changes the probabilities.
Connect random variables and sampling to Bayesian inference, tests, intervals and regression.
Introductory probability and statistics worksheets →Start with a single die or an equal-sector spinner when learners can count outcomes and write a fraction. Use two dice after they can list ordered pairs. Readiness matters more than the grade label on a preset.
The card activity covers single draws and repeated draws with replacement. Choose Conditional Probability above for generated draws without replacement and two-way tables. Keeping those models separate prevents using an unchanged denominator when the population has changed.
Activities provide separate answer editions; reference handouts explain the model without a separate practice key. Preview the selected worksheet before printing and keep its matching answer edition for checking.