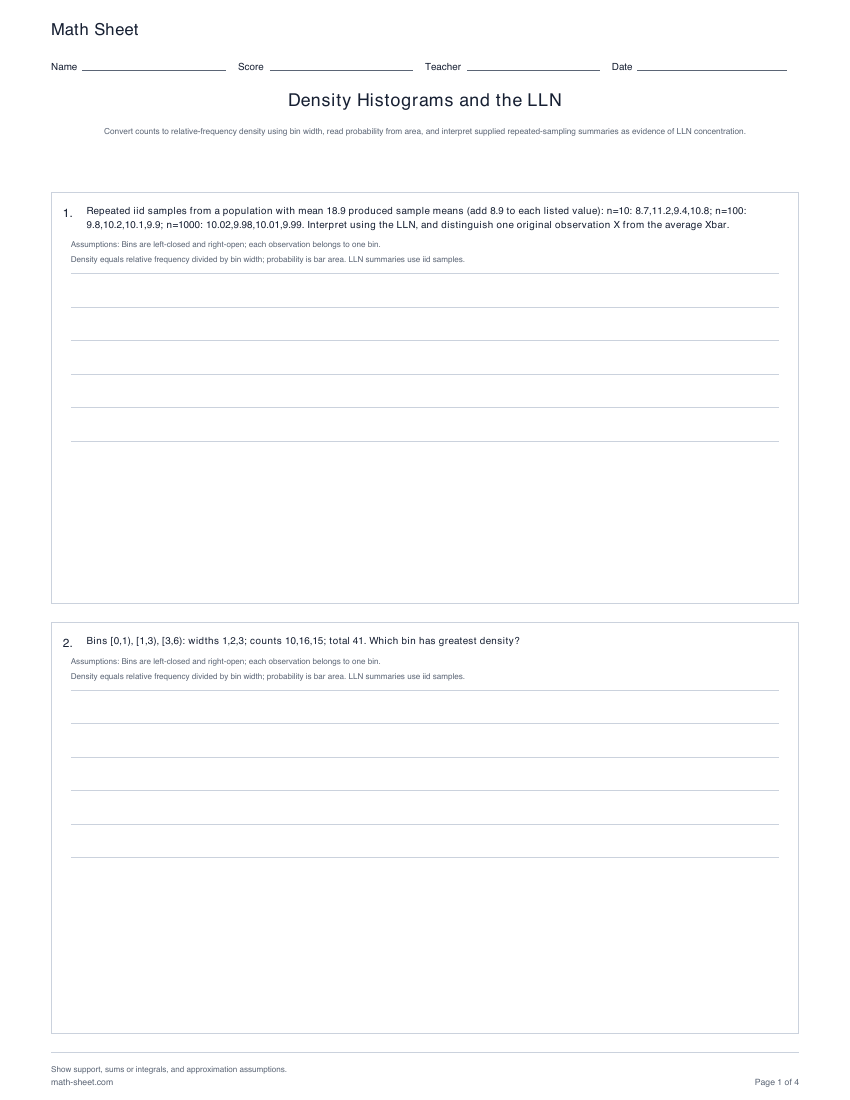
Math Sheet Name Score Teacher Date Density Histograms and the LLN Convert counts to relative-frequency density using bin width, read probability from area, and interpret supplied repeated-sampling summaries as evidence of LLN concentration. 1. Repeated iid samples from a population with mean 18.9 produced sample means (add 8.9 to each listed value): n=10: 8.7,11.2,9.4,10.8; n=100: 9.8,10.2,10.1,9.9; n=1000: 10.02,9.98,10.01,9.99. Interpret using the LLN, and distinguish one original observation X from the average Xbar. Assumptions: Bins are left-closed and right-open; each observation belongs to one bin. Density equals relative frequency divided by bin width; probability is bar area. LLN summaries use iid samples. 2. Bins [0,1), [1,3), [3,6): widths 1,2,3; counts 10,16,15; total 41. Which bin has greatest density? Assumptions: Bins are left-closed and right-open; each observation belongs to one bin. Density equals relative frequency divided by bin width; probability is bar area. LLN summaries use iid samples. Show support, sums or integrals, and approximation assumptions. math-sheet.com Page 1 of 4
Math Sheet Name Score Teacher Date Density Histograms and the LLN Convert counts to relative-frequency density using bin width, read probability from area, and interpret supplied repeated-sampling summaries as evidence of LLN concentration. 3. Bins [0,1), [1,3), [3,6): widths 1,2,3; counts 9,12,18; total 39. Find each relative-frequency density. Assumptions: Bins are left-closed and right-open; each observation belongs to one bin. Density equals relative frequency divided by bin width; probability is bar area. LLN summaries use iid samples. 4. Bins [0,1), [1,3), [3,6): widths 1,2,3; counts 9,10,19; total 38. Find the relative frequency in [1,3) from bar area. Assumptions: Bins are left-closed and right-open; each observation belongs to one bin. Density equals relative frequency divided by bin width; probability is bar area. LLN summaries use iid samples. Show support, sums or integrals, and approximation assumptions. math-sheet.com Page 2 of 4
Math Sheet Name Score Teacher Date Density Histograms and the LLN Convert counts to relative-frequency density using bin width, read probability from area, and interpret supplied repeated-sampling summaries as evidence of LLN concentration. 5. Bins [0,1), [1,3), [3,6): widths 1,2,3; counts 9,11,13; total 33. Explain how count and density heights differ while encoding the same frequencies. Assumptions: Bins are left-closed and right-open; each observation belongs to one bin. Density equals relative frequency divided by bin width; probability is bar area. LLN summaries use iid samples. 6. Bins [0,1), [1,3), [3,6): widths 1,2,3; counts 12,13,14; total 39. Which bin has greatest density? Assumptions: Bins are left-closed and right-open; each observation belongs to one bin. Density equals relative frequency divided by bin width; probability is bar area. LLN summaries use iid samples. Show support, sums or integrals, and approximation assumptions. math-sheet.com Page 3 of 4
Math Sheet Name Score Teacher Date Density Histograms and the LLN Convert counts to relative-frequency density using bin width, read probability from area, and interpret supplied repeated-sampling summaries as evidence of LLN concentration. 7. Bins [0,1), [1,3), [3,6): widths 1,2,3; counts 8,12,13; total 33. Explain how count and density heights differ while encoding the same frequencies. Assumptions: Bins are left-closed and right-open; each observation belongs to one bin. Density equals relative frequency divided by bin width; probability is bar area. LLN summaries use iid samples. 8. Bins [0,1), [1,3), [3,6): widths 1,2,3; counts 9,14,14; total 37. Find the relative frequency in [1,3) from bar area. Assumptions: Bins are left-closed and right-open; each observation belongs to one bin. Density equals relative frequency divided by bin width; probability is bar area. LLN summaries use iid samples. Show support, sums or integrals, and approximation assumptions. math-sheet.com Page 4 of 4