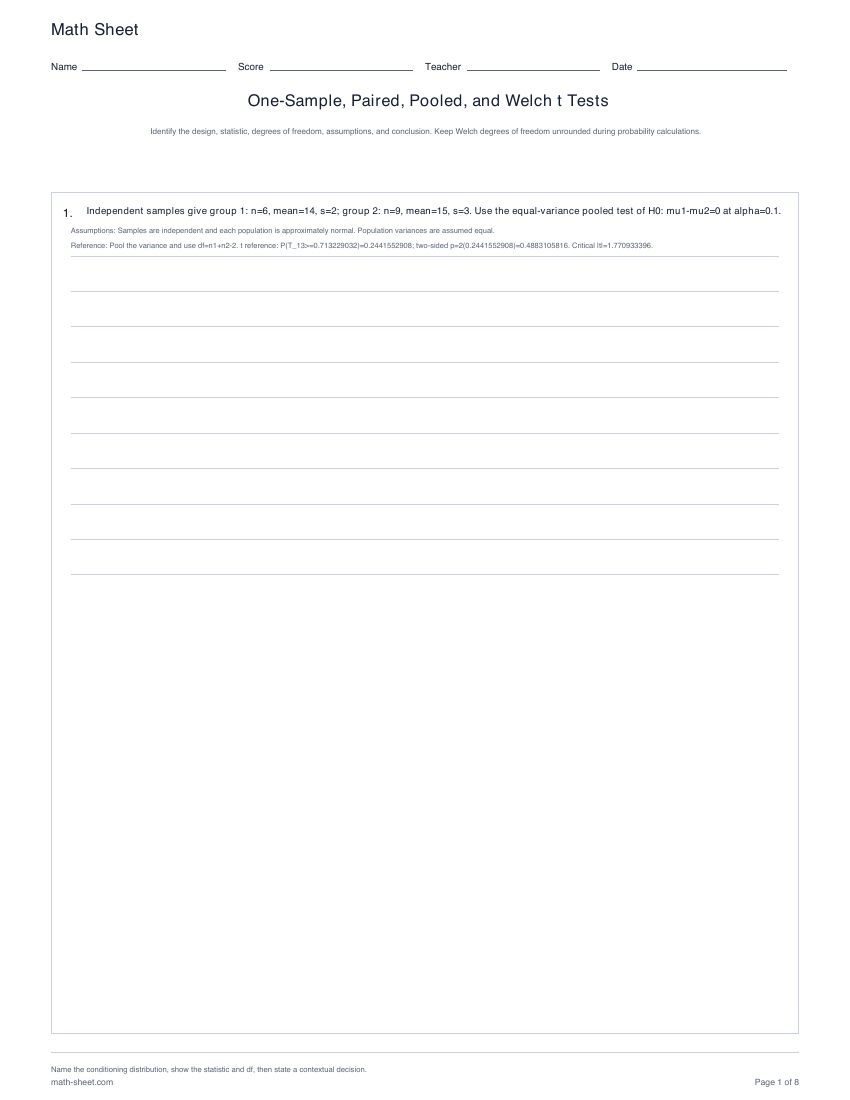
Math Sheet Name Score Teacher Date One-Sample, Paired, Pooled, and Welch t Tests Identify the design, statistic, degrees of freedom, assumptions, and conclusion. Keep Welch degrees of freedom unrounded during probability calculations. 1. Independent samples give group 1: n=6, mean=14, s=2; group 2: n=9, mean=15, s=3. Use the equal-variance pooled test of H0: mu1-mu2=0 at alpha=0.1. Assumptions: Samples are independent and each population is approximately normal. Population variances are assumed equal. Reference: Pool the variance and use df=n1+n2-2. t reference: P(T_13>=0.713229032)=0.2441552908; two-sided p=2(0.2441552908)=0.4883105816. Critical |t|=1.770933396. Name the conditioning distribution, show the statistic and df, then state a contextual decision. math-sheet.com Page 1 of 8
Math Sheet Name Score Teacher Date One-Sample, Paired, Pooled, and Welch t Tests Identify the design, statistic, degrees of freedom, assumptions, and conclusion. Keep Welch degrees of freedom unrounded during probability calculations. 2. Matched before values are 13,16,15,19,17; after values are 14,18,14,22,20. Test whether the mean paired change differs from 0 at alpha=0.01. Assumptions: Pairs are independent of other pairs; paired differences are approximately normal. Reference: Use d=after-before, t=d-bar/(s_d/sqrt(n)), df=n-1. t reference: P(T_4>=2.138089935)=0.0496503416; two-sided p=2(0.0496503416)=0.0993006832. Critical |t|=4.604094871. Name the conditioning distribution, show the statistic and df, then state a contextual decision. math-sheet.com Page 2 of 8
Math Sheet Name Score Teacher Date One-Sample, Paired, Pooled, and Welch t Tests Identify the design, statistic, degrees of freedom, assumptions, and conclusion. Keep Welch degrees of freedom unrounded during probability calculations. 3. A sample has n=8, x-bar=16, and s=3. Test H0: mu=12 against HA: mu differs from 12 at alpha=0.05. Assumptions: The observations are independent and the population is approximately normal. Reference: One-sample t=(x-bar-mu0)/(s/sqrt(n)), df=n-1. t reference: P(T_7>=3.771236166)=0.0034858275; two-sided p=2(0.0034858275)=0.0069716550. Critical |t|=2.364624252. Name the conditioning distribution, show the statistic and df, then state a contextual decision. math-sheet.com Page 3 of 8
Math Sheet Name Score Teacher Date One-Sample, Paired, Pooled, and Welch t Tests Identify the design, statistic, degrees of freedom, assumptions, and conclusion. Keep Welch degrees of freedom unrounded during probability calculations. 4. Independent samples give group 1: n=9, mean=17, s=3.5; group 2: n=7, mean=15, s=7. Use the unequal-variance Welch test of H0: mu1-mu2=0 at alpha=0.1. Assumptions: Samples are independent and each population is approximately normal. Equal variances are not assumed. Reference: Use SE=sqrt(s1^2/n1+s2^2/n2) and Welch-Satterthwaite df without rounding. t reference: P(T_8.324141812>=0.691668501)=0.2539874797; two-sided p=2(0.2539874797)=0.5079749594. Critical |t|=1.850204075. Name the conditioning distribution, show the statistic and df, then state a contextual decision. math-sheet.com Page 4 of 8
Math Sheet Name Score Teacher Date One-Sample, Paired, Pooled, and Welch t Tests Identify the design, statistic, degrees of freedom, assumptions, and conclusion. Keep Welch degrees of freedom unrounded during probability calculations. 5. Matched before values are 16,19,18,22,20; after values are 17,21,17,25,22. Test whether the mean paired change differs from 0 at alpha=0.01. Assumptions: Pairs are independent of other pairs; paired differences are approximately normal. Reference: Use d=after-before, t=d-bar/(s_d/sqrt(n)), df=n-1. t reference: P(T_4>=2.064187386)=0.0539694112; two-sided p=2(0.0539694112)=0.1079388224. Critical |t|=4.604094871. Name the conditioning distribution, show the statistic and df, then state a contextual decision. math-sheet.com Page 5 of 8
Math Sheet Name Score Teacher Date One-Sample, Paired, Pooled, and Welch t Tests Identify the design, statistic, degrees of freedom, assumptions, and conclusion. Keep Welch degrees of freedom unrounded during probability calculations. 6. A sample has n=6, x-bar=19, and s=2.5. Test H0: mu=10 against HA: mu differs from 10 at alpha=0.05. Assumptions: The observations are independent and the population is approximately normal. Reference: One-sample t=(x-bar-mu0)/(s/sqrt(n)), df=n-1. t reference: P(T_5>=8.818163074)=0.0001557151; two-sided p=2(0.0001557151)=0.0003114302. Critical |t|=2.570581836. Name the conditioning distribution, show the statistic and df, then state a contextual decision. math-sheet.com Page 6 of 8
Math Sheet Name Score Teacher Date One-Sample, Paired, Pooled, and Welch t Tests Identify the design, statistic, degrees of freedom, assumptions, and conclusion. Keep Welch degrees of freedom unrounded during probability calculations. 7. Independent samples give group 1: n=7, mean=20, s=3; group 2: n=10, mean=15, s=3. Use the equal-variance pooled test of H0: mu1-mu2=0 at alpha=0.1. Assumptions: Samples are independent and each population is approximately normal. Population variances are assumed equal. Reference: Pool the variance and use df=n1+n2-2. t reference: P(T_15>=3.381997708)=0.0020533544; two-sided p=2(0.0020533544)=0.0041067088. Critical |t|=1.753050356. Name the conditioning distribution, show the statistic and df, then state a contextual decision. math-sheet.com Page 7 of 8
Math Sheet Name Score Teacher Date One-Sample, Paired, Pooled, and Welch t Tests Identify the design, statistic, degrees of freedom, assumptions, and conclusion. Keep Welch degrees of freedom unrounded during probability calculations. 8. Independent samples give group 1: n=8, mean=14, s=3.5; group 2: n=11, mean=15, s=7. Use the unequal-variance Welch test of H0: mu1-mu2=0 at alpha=0.01. Assumptions: Samples are independent and each population is approximately normal. Equal variances are not assumed. Reference: Use SE=sqrt(s1^2/n1+s2^2/n2) and Welch-Satterthwaite df without rounding. t reference: P(T_15.448794462>=0.408732399)=0.3441729238; two-sided p=2(0.3441729238)=0.6883458476. Critical |t|=2.934610110. Name the conditioning distribution, show the statistic and df, then state a contextual decision. math-sheet.com Page 8 of 8