Find an output by substituting a number or an expression into a function. Combine two functions, practice composition, or calculate a rate from a table, a graph or a symbolic difference quotient.
Start with mappings, ordered pairs and continuous graphs to classify functions and read domains and ranges. Continue with evaluation, operations, rates, inverses and graphing. Every activity includes a separate worked key.
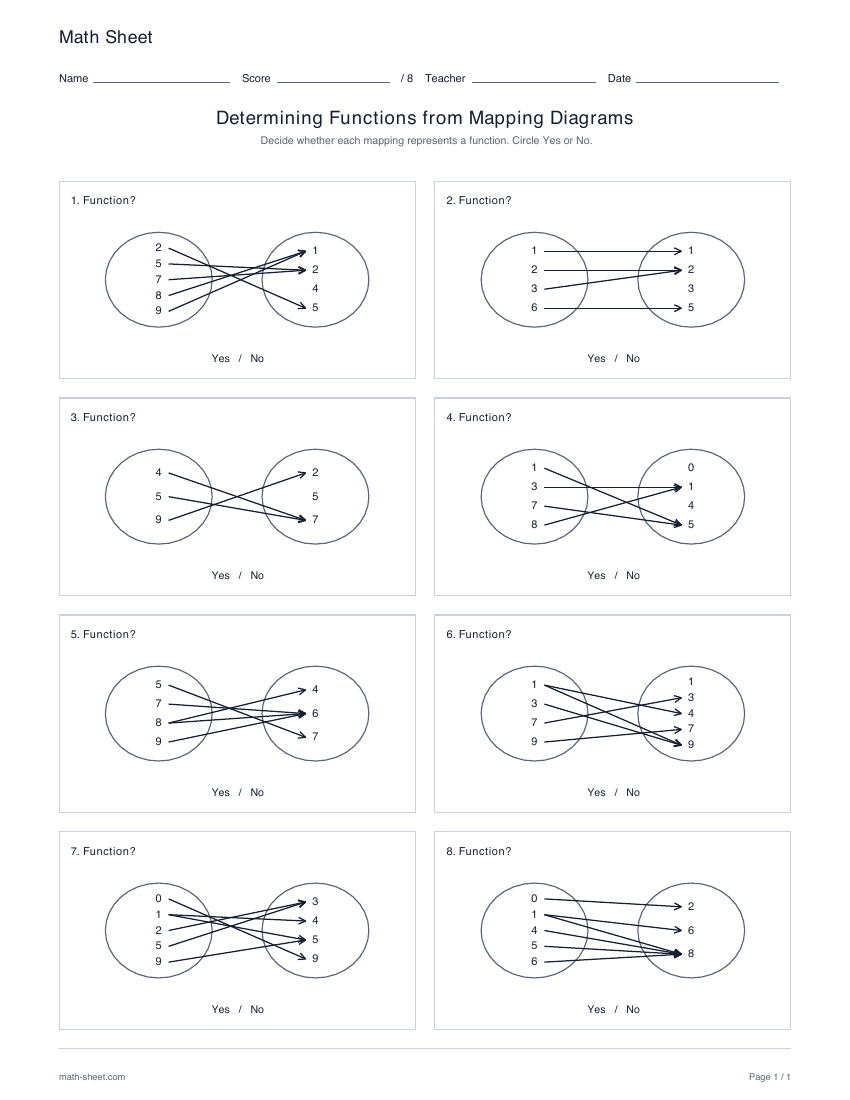
Classify eight mapping diagrams as functions or nonfunctions. Choose two to five numeric or letter values on each side, with four of each classification and a separate answer key.
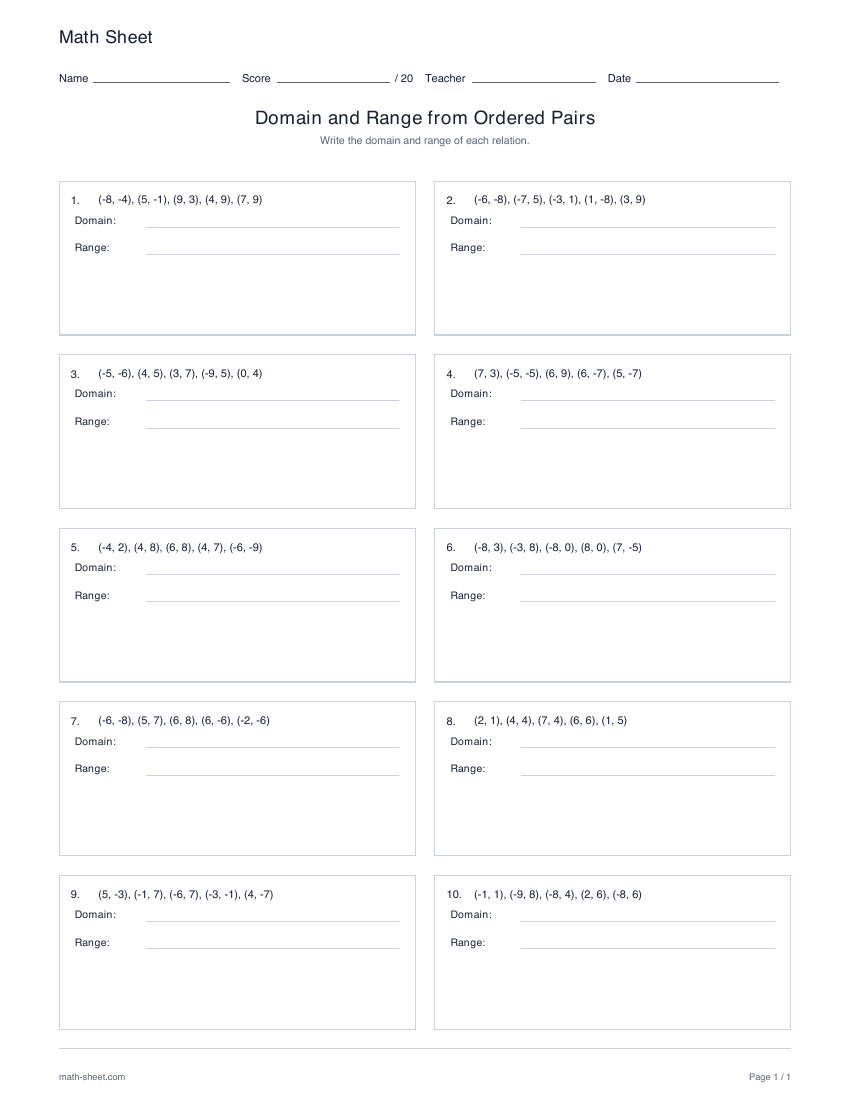
Find the domain and range of ten five-pair relations. Choose negative or nonnegative coordinates, control repeats independently and optionally classify each relation as a function.
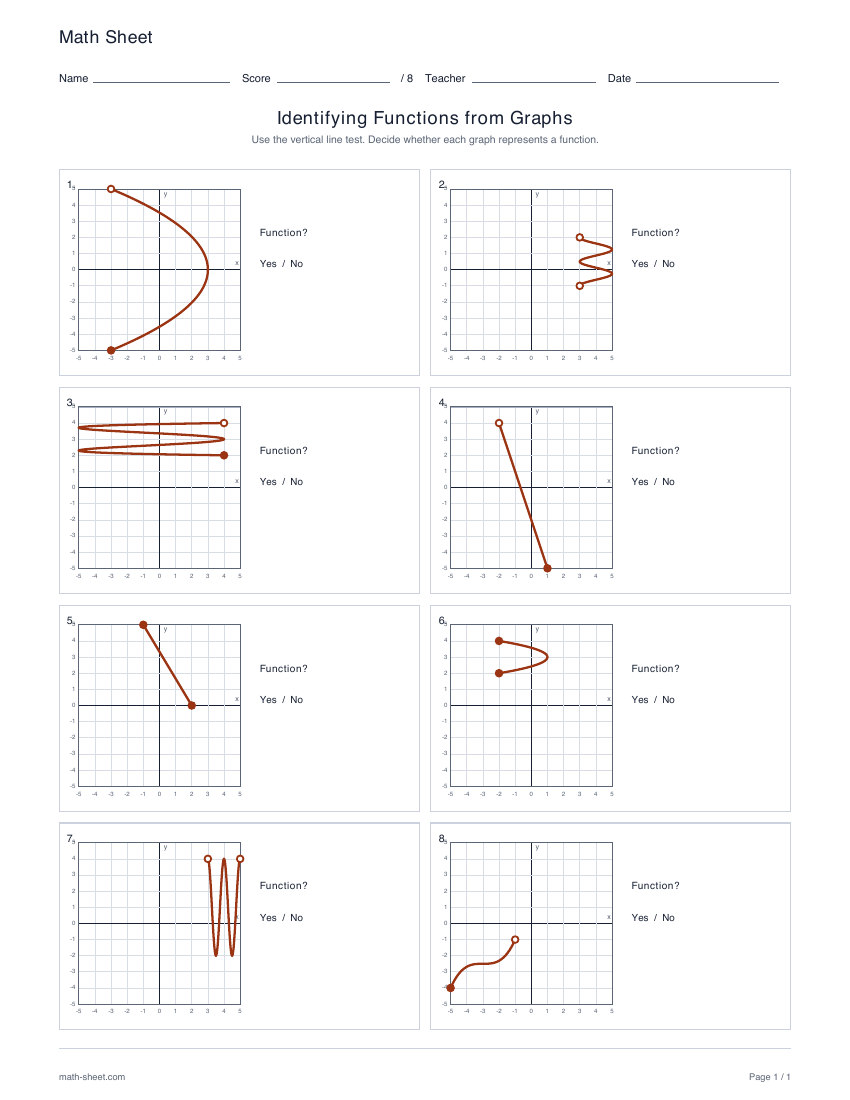
Apply the vertical line test to eight finite graph relations. Choose lines, polynomials, special curves, horizontal parabolas or rotated curves, with balanced endpoints and a separate key.
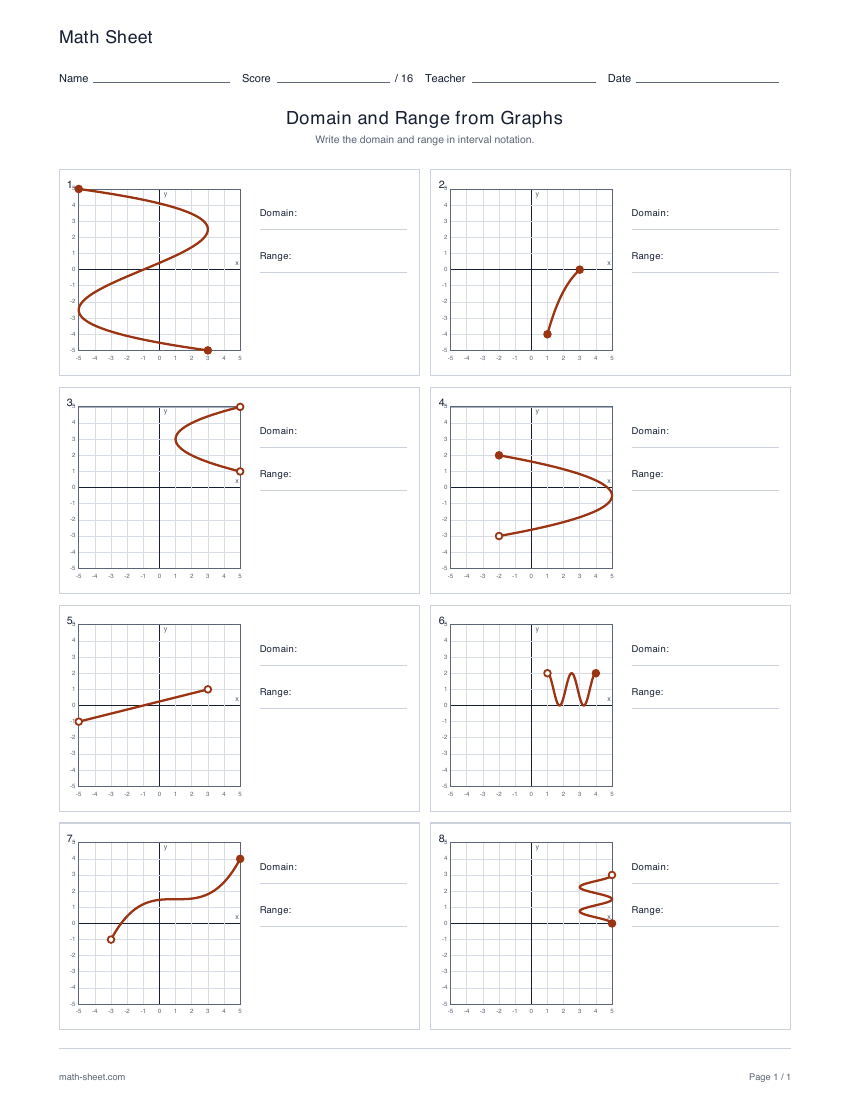
Read finite domain and range intervals from eight varied relation graphs. Practice open and closed extrema and optionally apply the vertical line test.
Add, subtract, multiply, divide and compose polynomial functions. Choose numbers, variables or mixed inputs, with ten questions and a separate worked answer key.
Simplify eight difference quotients with polynomial, factored and rational functions. Choose two inputs or an increment, add a formula reminder and print worked answers.
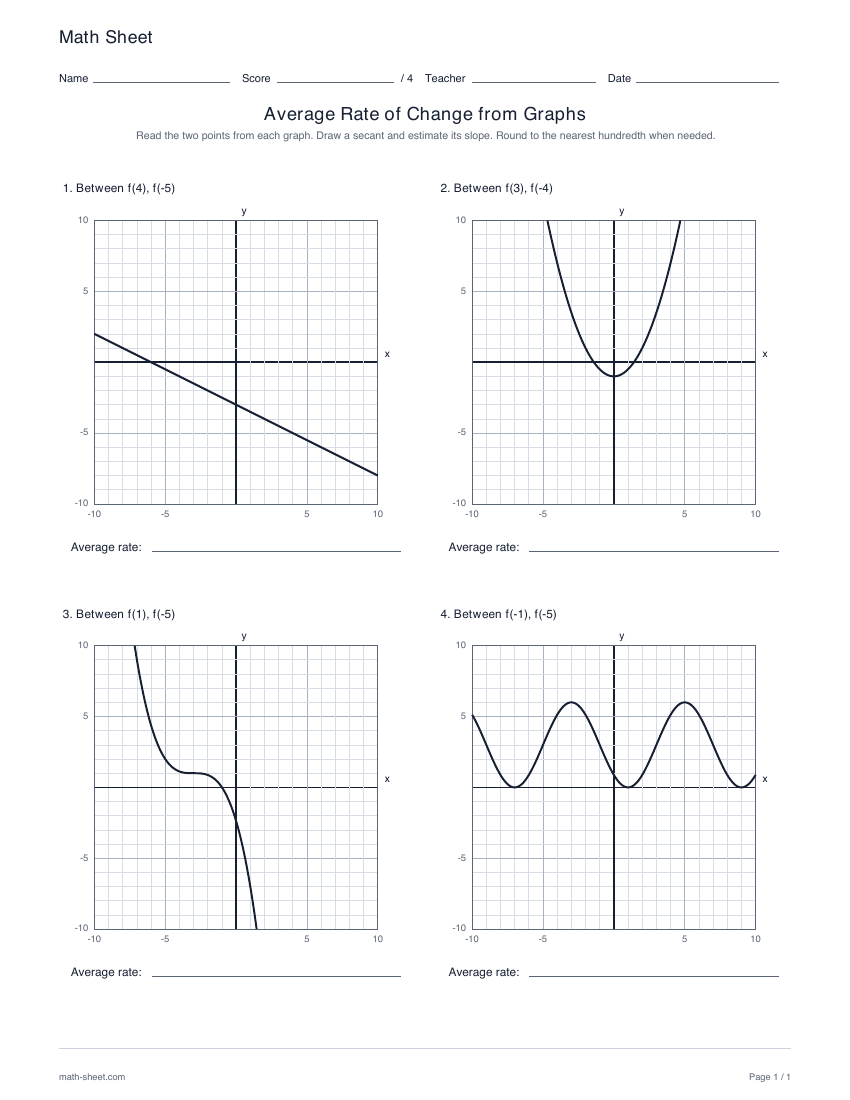
Read four function graphs and estimate their average rates of change. Choose linear, quadratic, cubic, sine or exponential curves, with secants and worked answers.
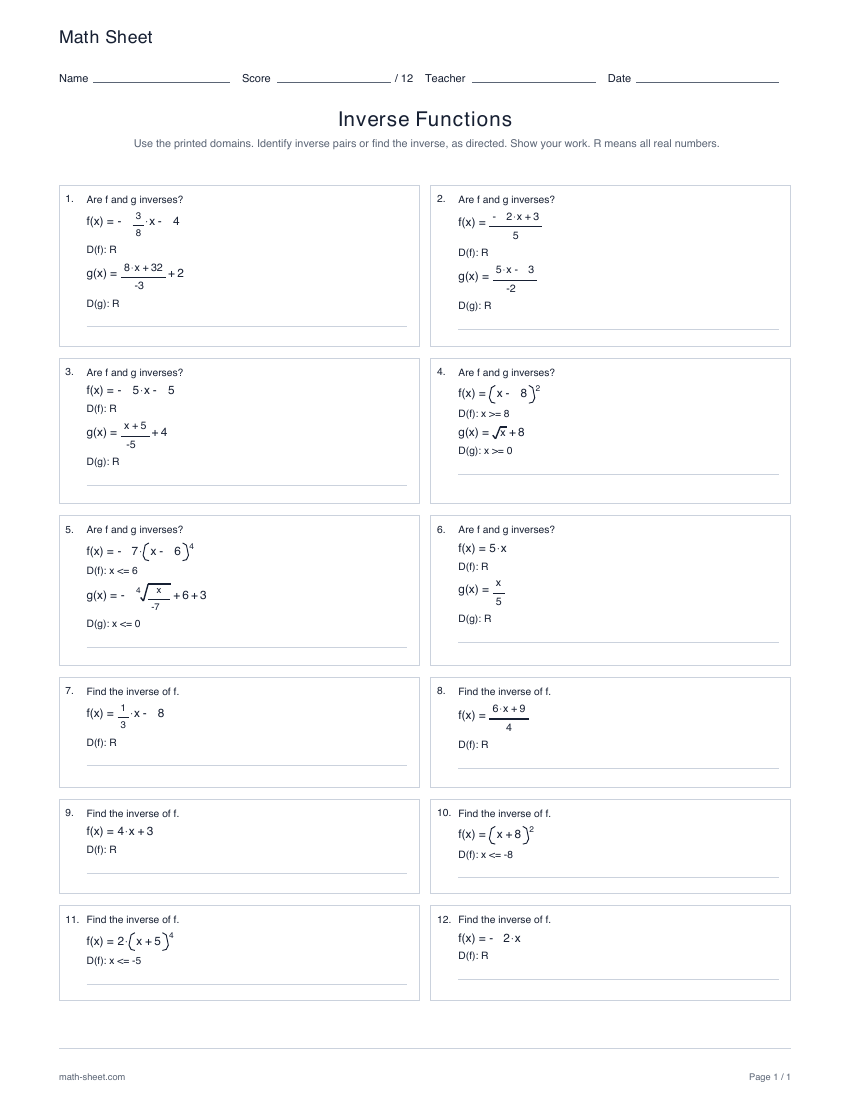
Identify inverse pairs or find inverse functions in twelve original questions. Practice linear functions and powers with explicit domains, exact radicals and worked answers.
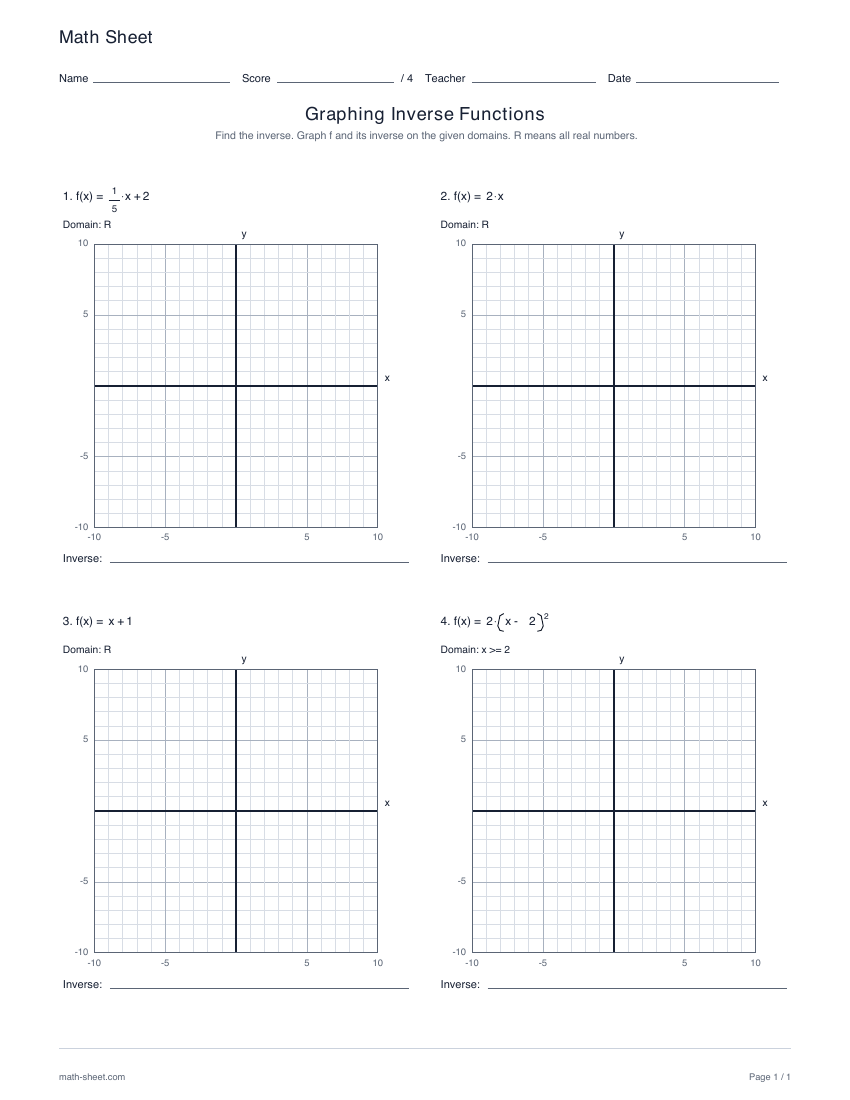
Find and graph four inverse functions. Choose fractional or integer linear rules, lines through the origin, quadratic branches and cubic functions, with completed graph keys.
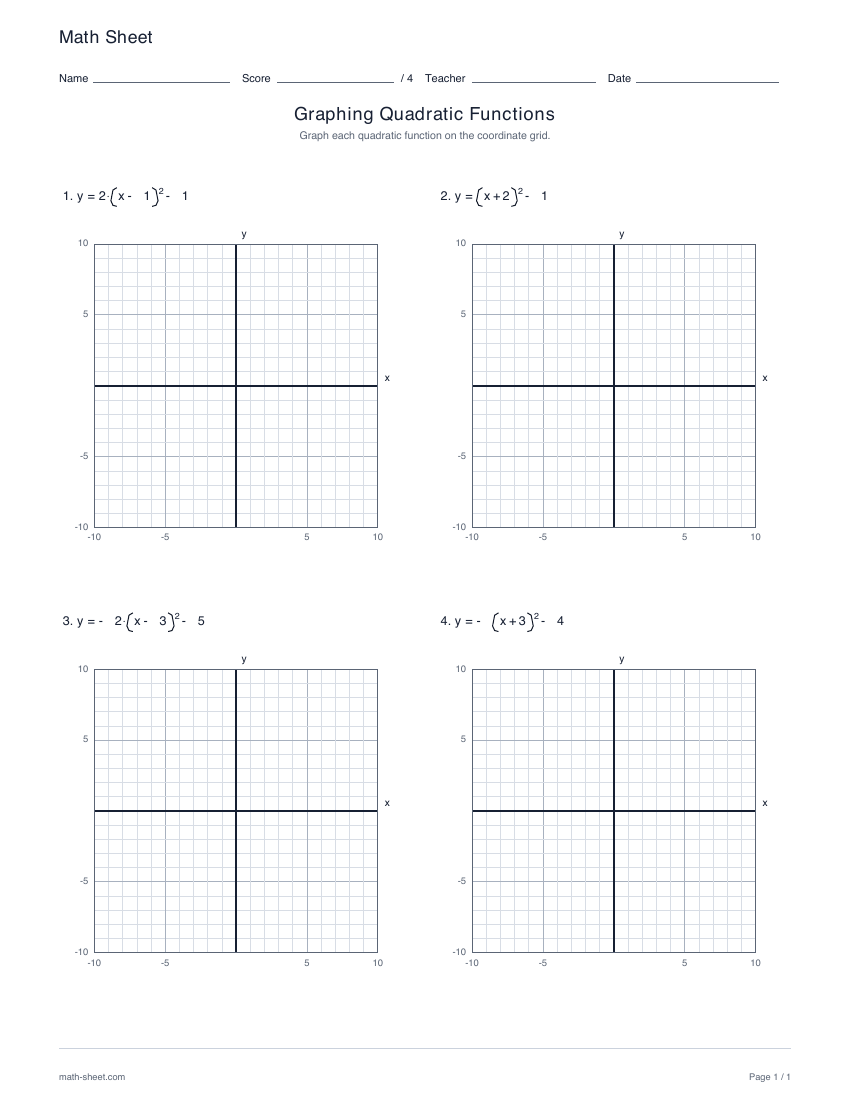
Graph four quadratic functions in vertex form on blank coordinate grids. Each sheet includes every leading coefficient from −2, −1, 1 and 2, with a separate completed graph key.
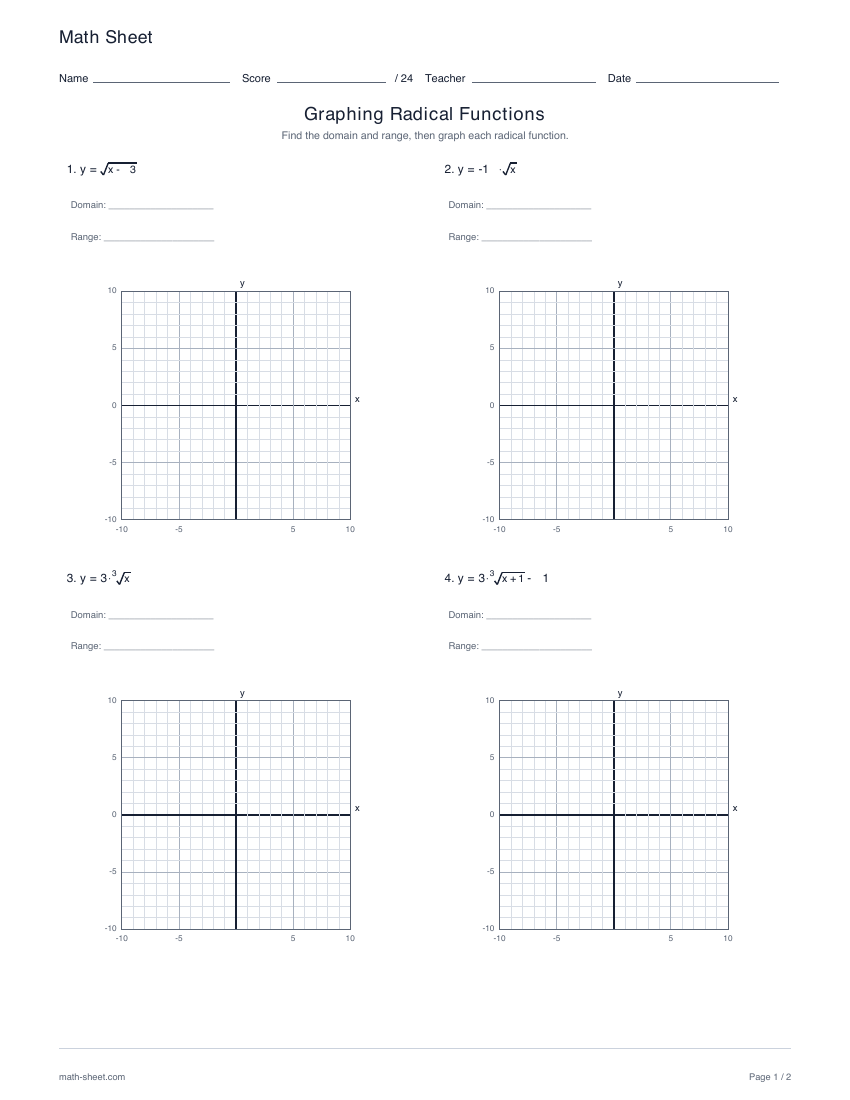
Find the domain and range, then graph eight transformed square-root and cube-root functions on unit grids. Choose square roots, cube roots or balanced mixed practice with separate completed graph keys.
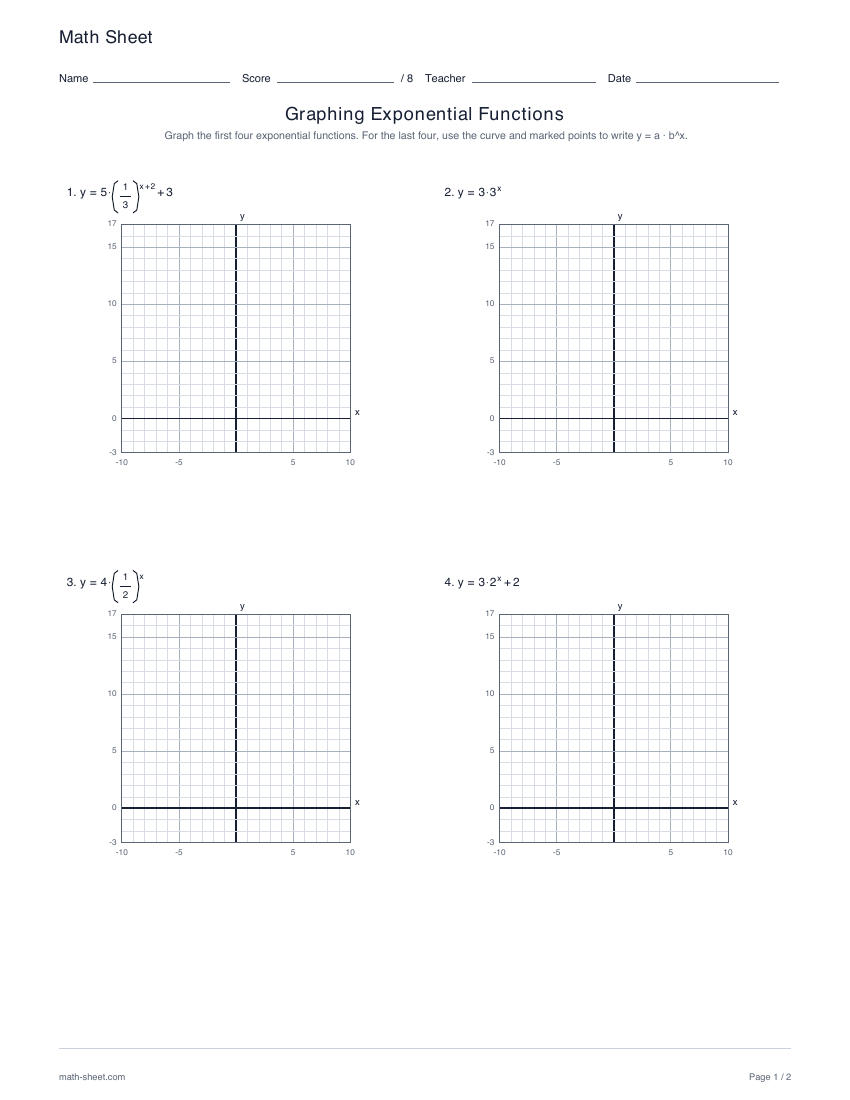
Graph eight exponential functions or write equations from curves with exact marked points. Compare growth, decay and translations on fixed unit grids with separate answer keys.
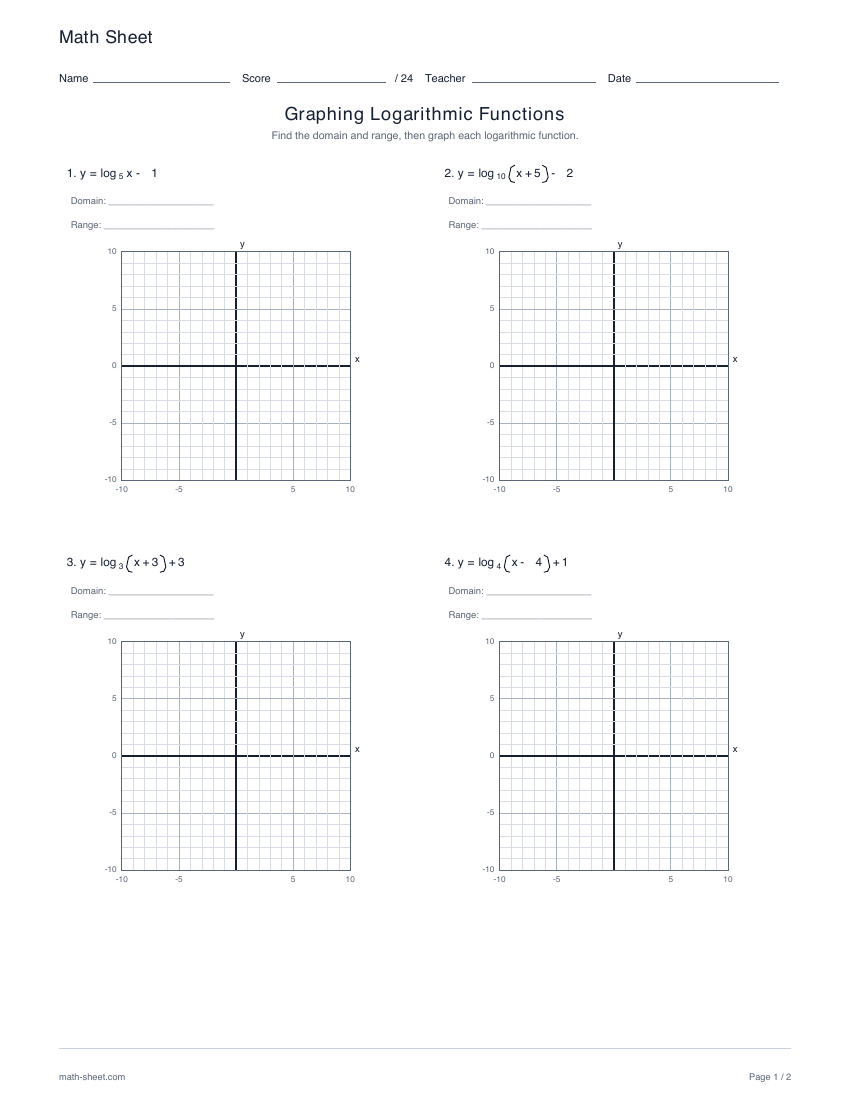
Find exact domains and all-real ranges, then graph eight logarithmic functions with vertical asymptotes on fixed square grids. Includes affine arguments, fractional boundaries and separate answer keys.
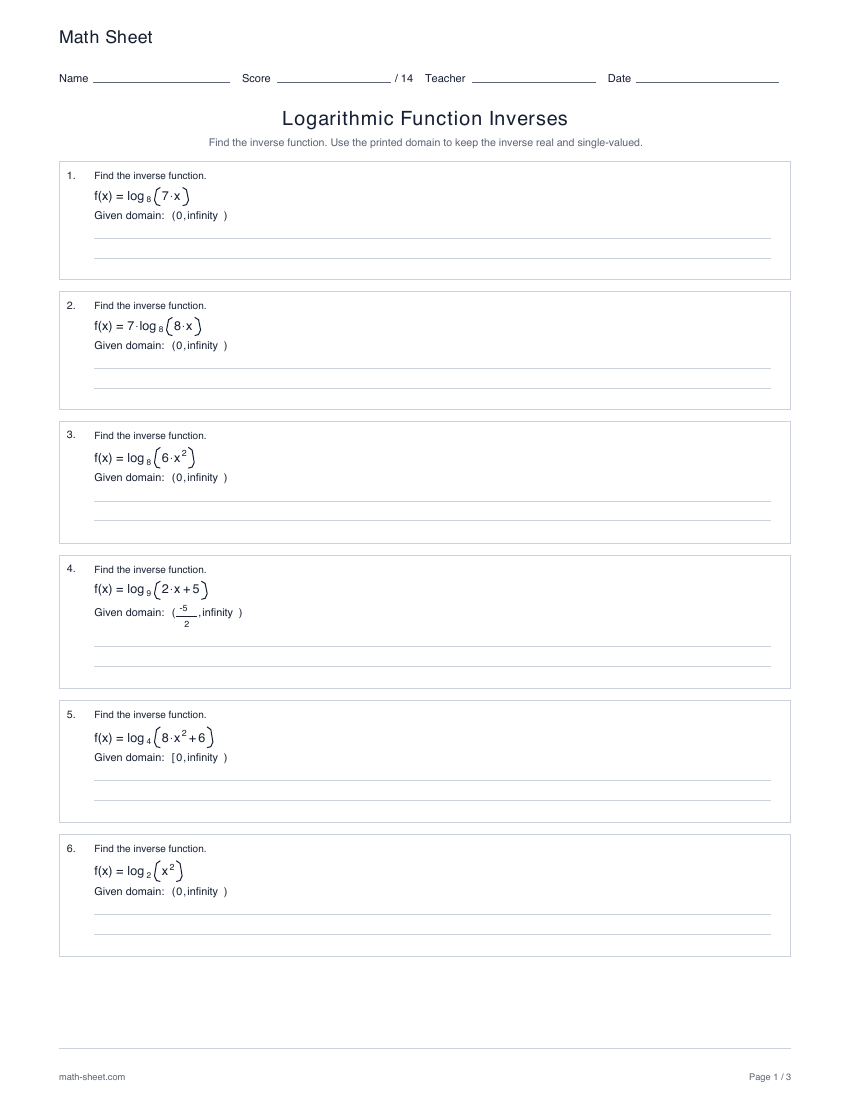
Find inverses in logarithmic, exponential or mixed directions across six exact forms. Every problem prints the real domain needed for a single-valued inverse, with separate exact answer keys.
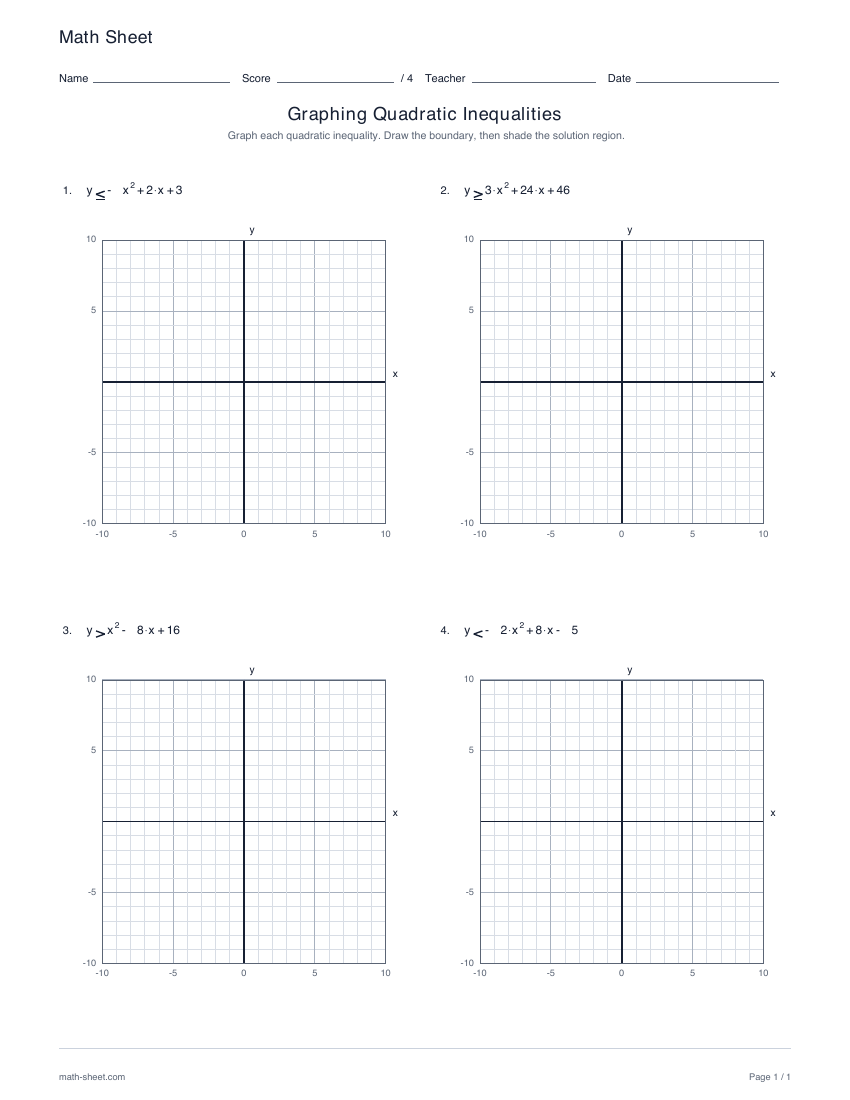
Graph four expanded quadratic inequalities on blank coordinate grids. Compare unit and nonunit leading coefficients, both opening directions and all four strict or inclusive relations.
Preview and download →
Choose a starting point
One interval per table
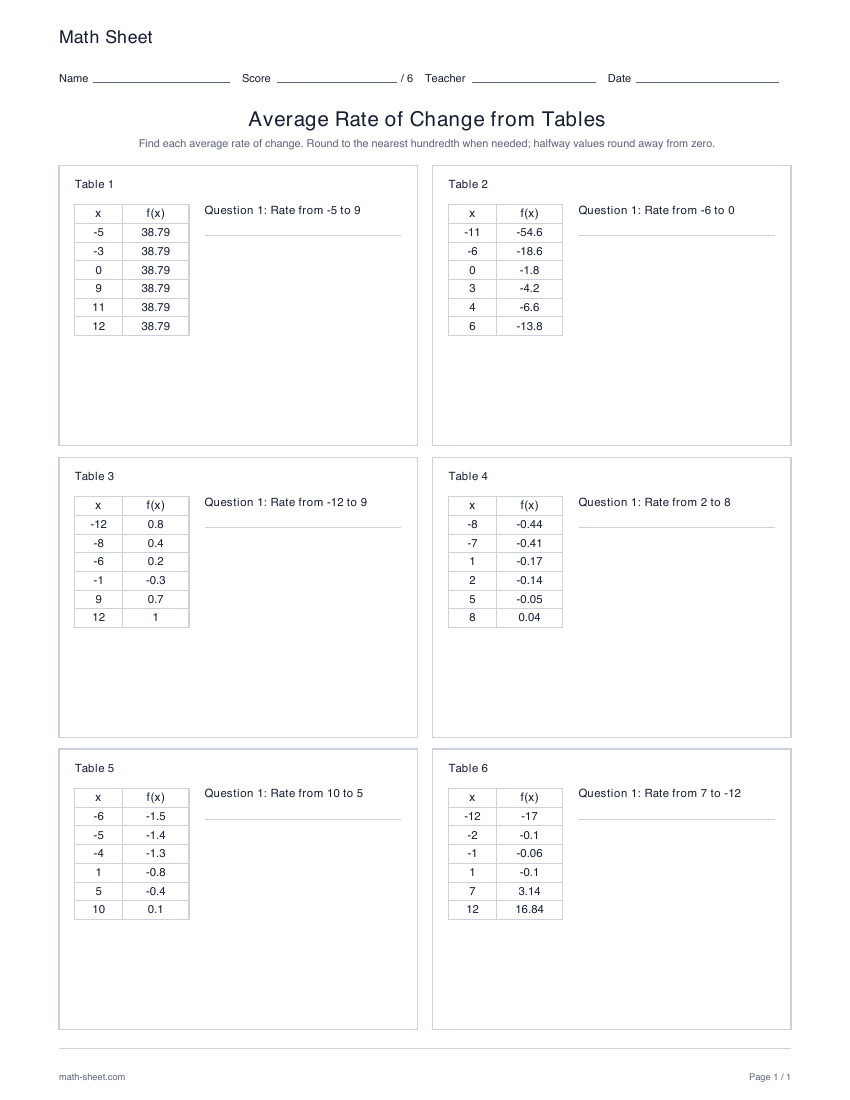
Six questions, each using a different table. Focus on choosing the correct rows and subtraction order.
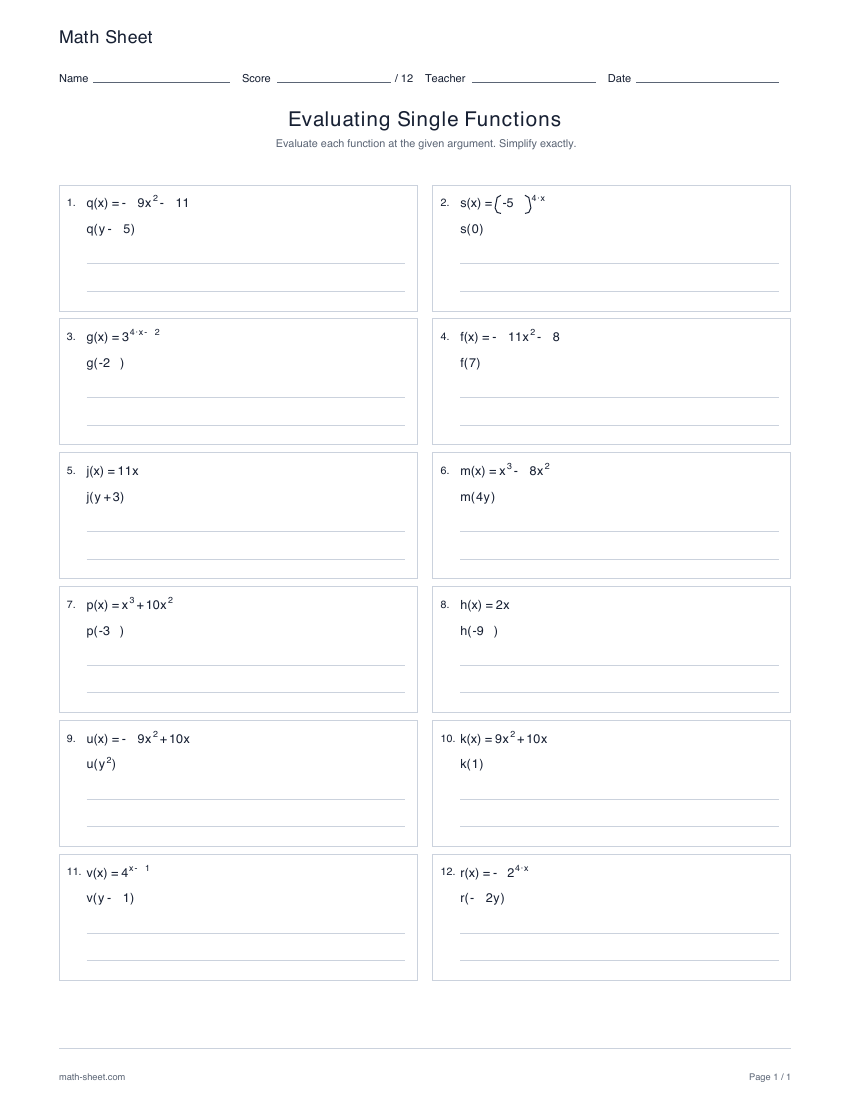
The input in f(2x + 1) is the complete expression 2x + 1. Substitute it everywhere the variable occurs and keep the parentheses until you have expanded the powers.
Start with numbers
Evaluate twelve numerical inputs, including signed values and exact fractions from negative exponents.
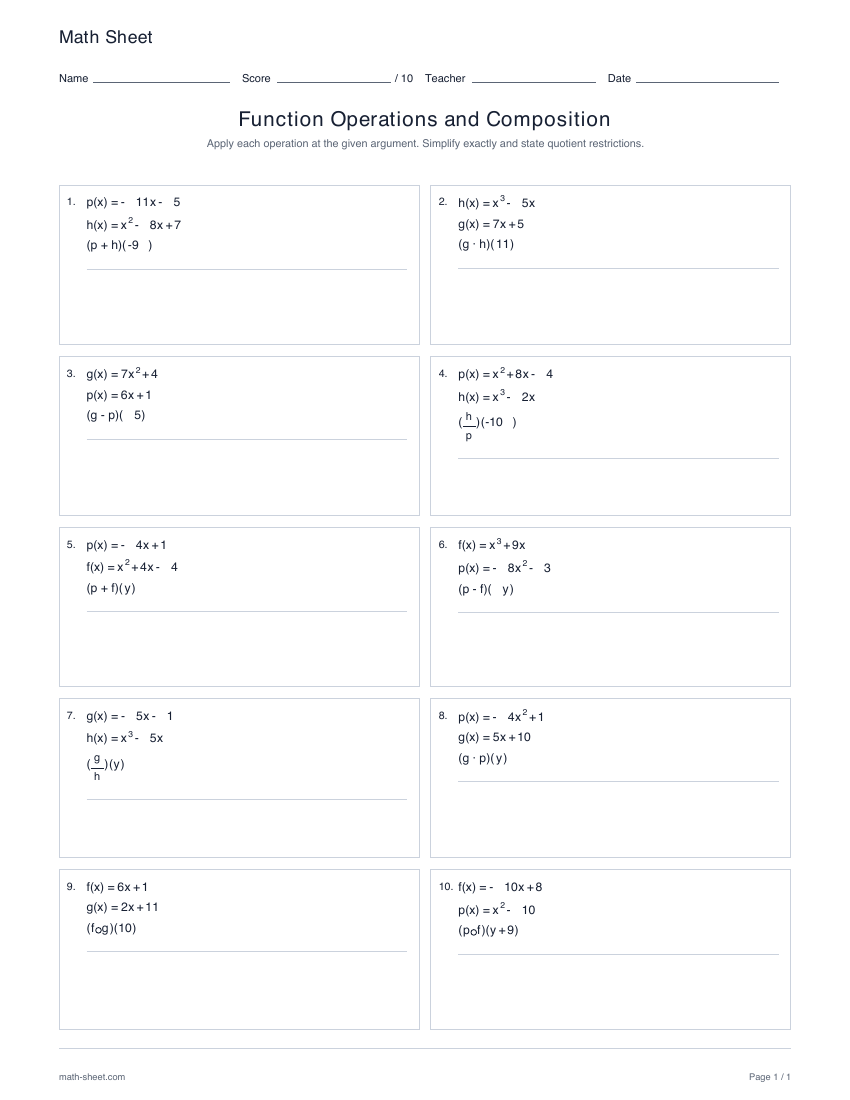
Adding or multiplying functions uses the same input in both. Composition works in stages: in (f ∘ g)(x), calculate g first and substitute its output into f. A quotient also needs its original denominator to stay nonzero.
Combine function values
Start with numerical inputs and practice addition, subtraction, multiplication and exact division.
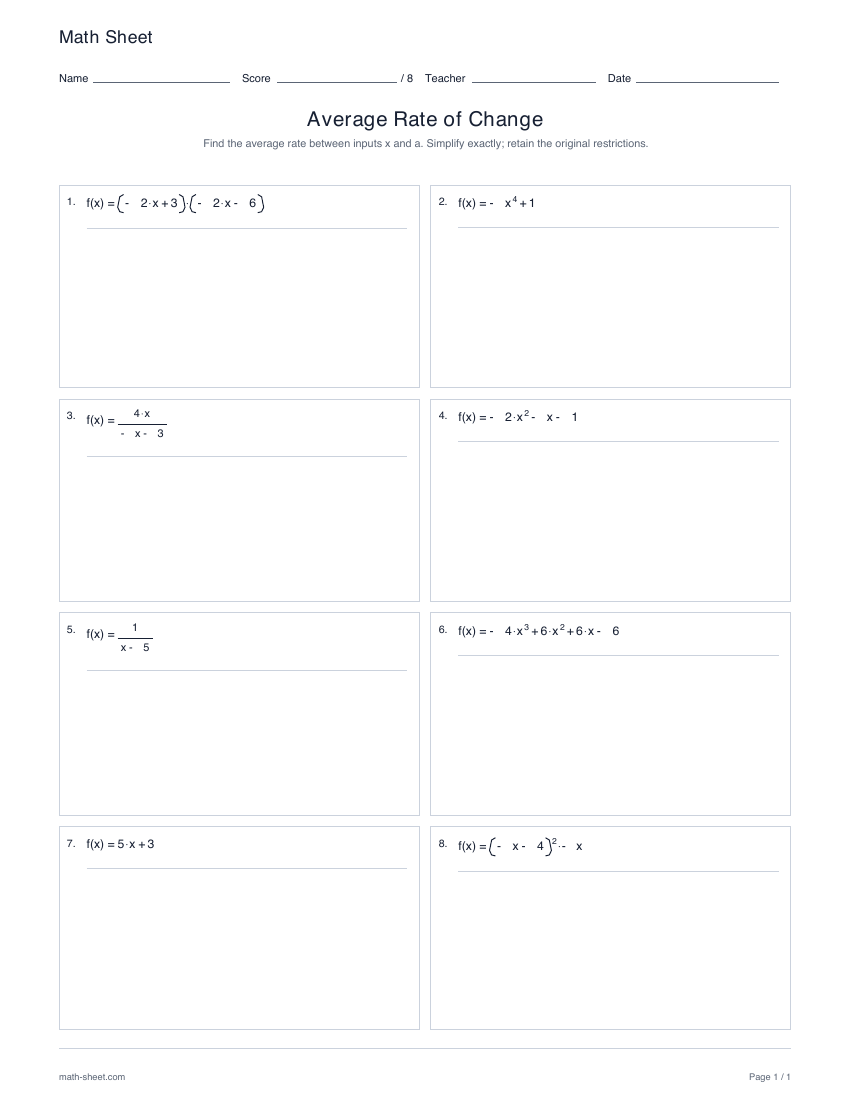
Practice with expanded and factored polynomials, reciprocal functions and rational functions. The two inputs can be x and a, or x and x + h. Simplifying changes the expression, but it does not remove the original restrictions.
Introduce the difference quotient
Compare inputs x and a with the formula printed above the eight questions.
A secant joins two points on a curve. Its slope describes average change across the interval, even when the curve bends or turns between them. Read the two endpoints before calculating.
Compare four curve shapes
Read a linear, quadratic, cubic and sine graph. Compare average change with the shape between the endpoints.
An inverse swaps inputs and outputs. A linear rule with nonzero slope has an inverse on all real numbers; an even power first needs a one-to-one branch. Read the printed domains before choosing a root sign.
Recognize inverse pairs
Twelve pairs, with six true inverses and six incorrect matches. Use the printed domains and check the compositions.
Find the inverse formula, then reflect points across y = x. A restricted quadratic branch becomes a square-root graph; a cubic becomes a real cube-root graph. Keep the stated domains visible.
Reflect straight lines
Compare fractional and integer slopes, including lines through the origin, on four blank coordinate grids.
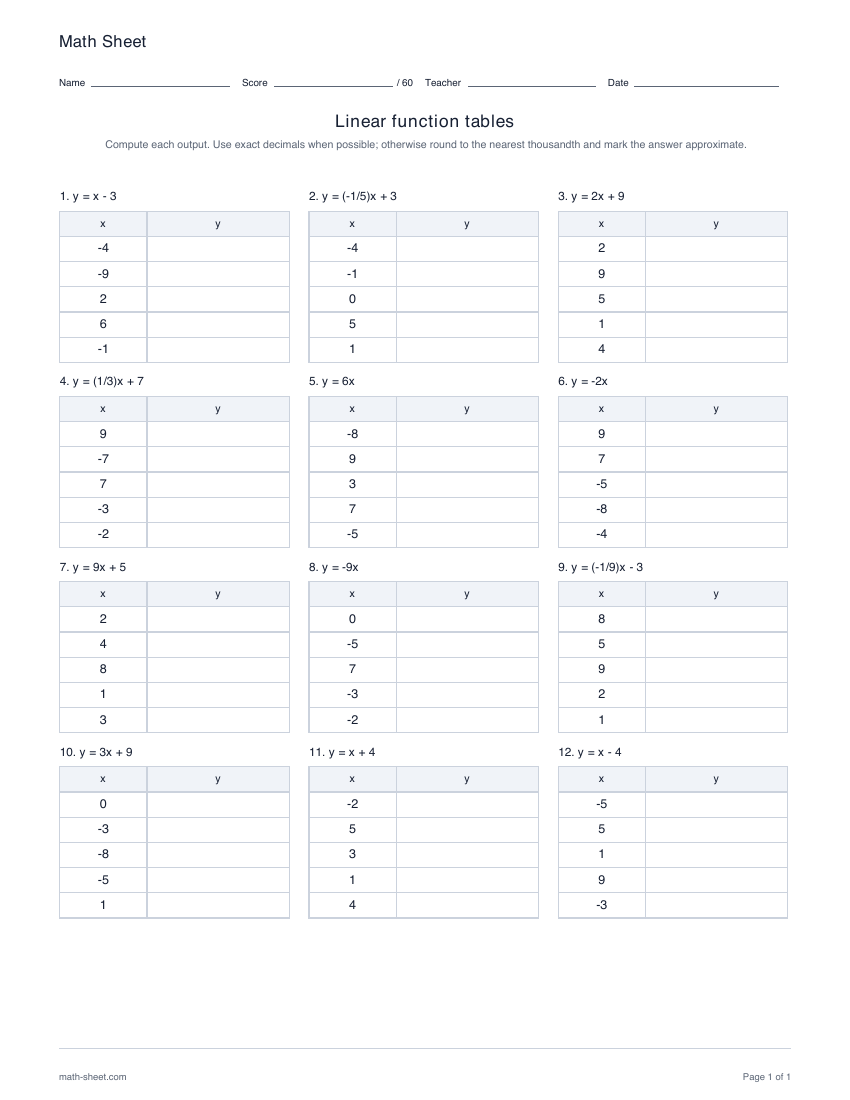
Substitute five inputs into each of twelve linear rules. Choose whole or fractional slopes, signed or nonnegative inputs, and decimal or exact fraction answers.
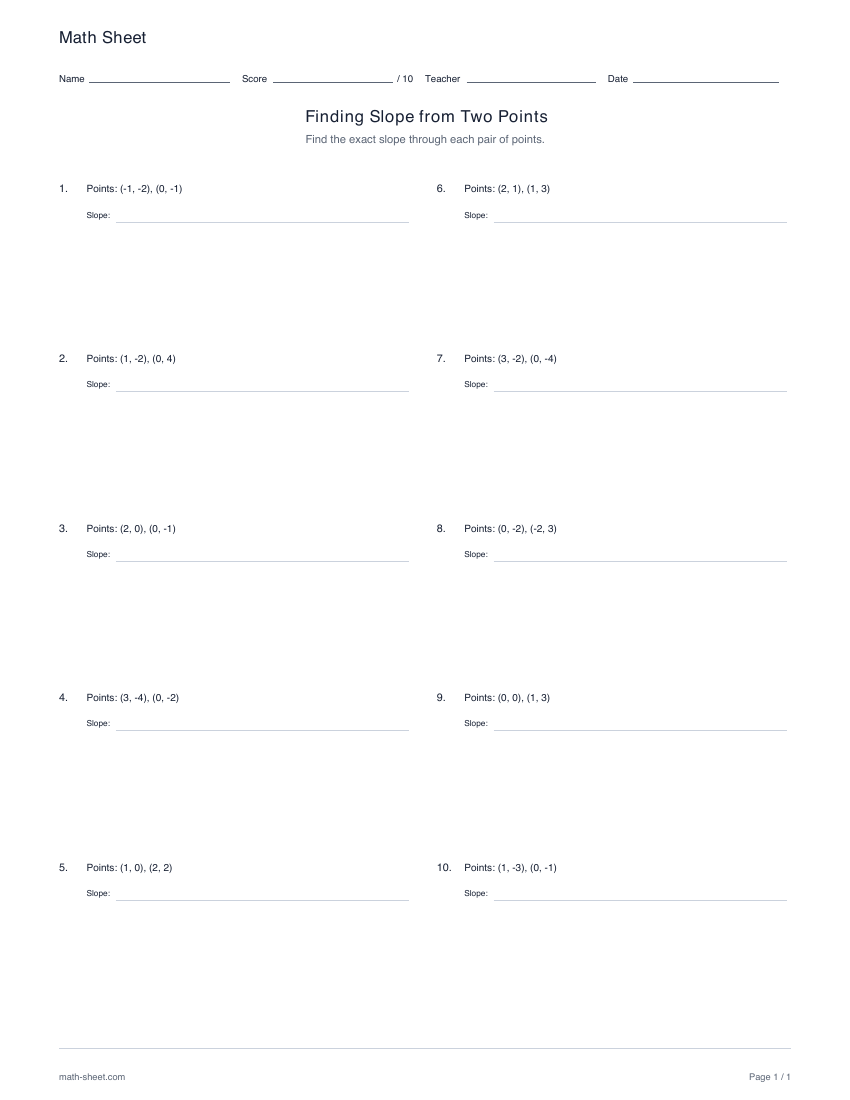
Calculate exact slopes from ten pairs of integer-coordinate points. Practice signed differences and reduced fractions, with a separate key that explains the slope calculation.
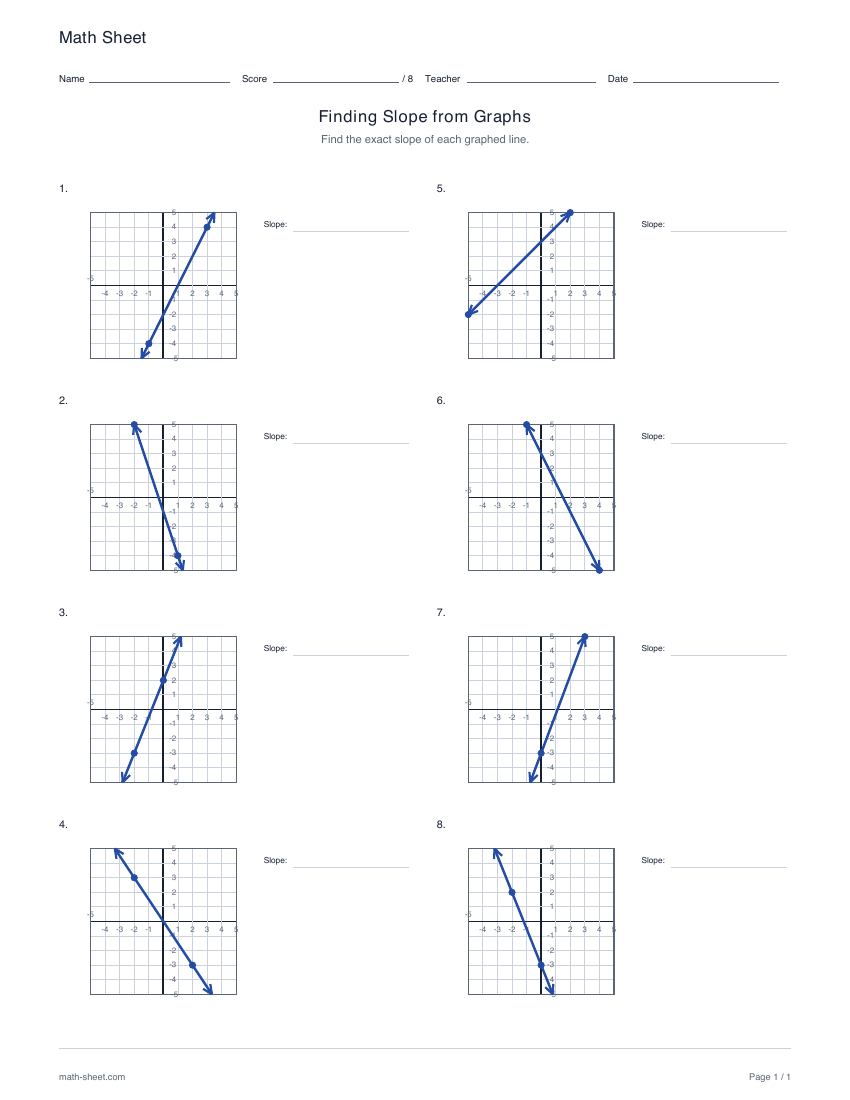
Read eight graphed lines and find each exact slope. Use the coordinate scale to compare rise and run, then check a separate answer key with worked calculations.
Preview and download →
Questions for planning a lesson
Are average rate and slope the same?
The average rate between two function values is the slope of the line joining those two points. A linear function has the same rate on every interval; other functions can have different rates on different intervals.
Does 12 questions mean 12 tables?
No. Both settings have six tables with six data pairs each. The 12-question setting asks about two different intervals in every table.
When should learners round?
Function evaluation uses exact results, including fractions. For the table-rate activity, keep the displayed values exact through subtraction and division, then round the final rate to the nearest hundredth when needed. Its key clearly marks approximations.
How are halfway answers rounded?
These worksheets use halfway rounding away from zero. For example, 1.235 rounds to 1.24 and −1.235 to −1.24. This rule is stated on the printed worksheet.
Can I keep the same questions?
Yes. Copy the settings link to preserve the seed and options. Changing paper size or print language keeps the mathematical data. In table-rate practice, increasing to 12 questions also preserves each table and its first question.
Which curriculum does this follow?
Choose this practice by skill. Course names and grade placement vary between curricula; this collection does not claim alignment with a specific curriculum.
Continue with Algebra 2
Combine function work with signed arithmetic, expressions and complex-number practice when those skills match the lesson.