General functions practice

Graphing quadratic inequalities worksheets

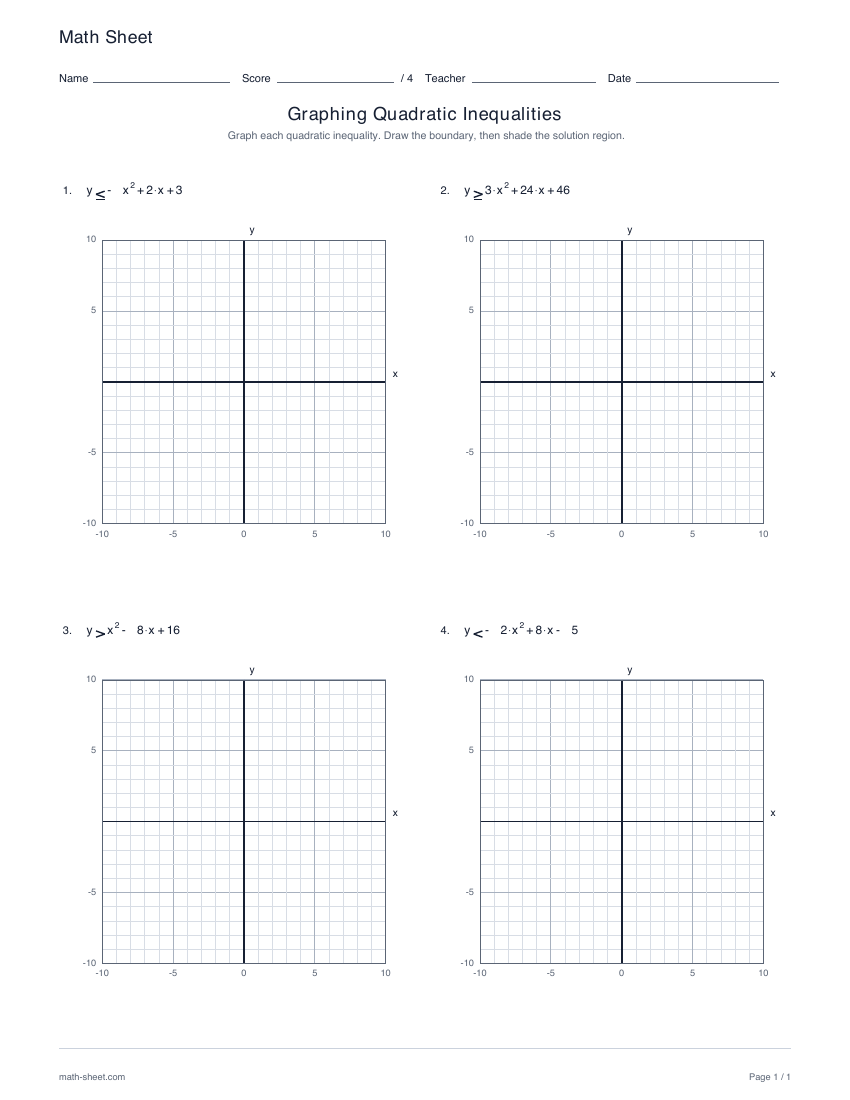
Graph four expanded quadratic inequalities on blank coordinate grids. Compare unit and nonunit leading coefficients, both opening directions and all four strict or inclusive relations.

Ready-made English PDF · fixed settings

Customization below makes a separate PDF.

Fixed English ready-made files. Custom settings below apply only to the configured PDF.

Ready to print

Start with a ready-made worksheet

Graph the quadratic boundary. Use a dashed curve for < or > and a solid curve for <= or >=. Test a point, then shade the side that satisfies the inequality.

Download the practice pages alone, or include a separate answer key or teacher model. Longer activities may use more than one page.

Customize this worksheet

Paper sizes and printing help · More general functions activities

Draw the boundary. Test the region.

Each worksheet has four expanded quadratic inequalities on unit grids from −10 to 10. Every sheet includes <, ≤, > and ≥ once, with the selected leading-coefficient magnitudes and opening directions.

Strict inequalities use a dashed parabola. Inclusive inequalities use a solid parabola. Test a point away from the boundary before shading the satisfying side.

Learning objective

What this activity builds

Draw a solid or dashed parabolic boundary and shade exactly the points that satisfy a quadratic inequality.

Worked example

Graph y >= 2x² − 4x + 4.

The boundary is the solid parabola with vertex (1, 2). Shade above the curve.

Equality is included, so the boundary is solid. The point (1, 3) satisfies 3 >= 2, while (1, 1) does not.

Teaching notes

Make the practice count

  • Rewrite or inspect the expanded quadratic to locate its vertex.
  • Draw a dashed boundary for strict relations.
  • Draw a solid boundary when equality is included.
  • Test a point clearly away from the parabola.
  • Shade every visible point on the satisfying side.

Make it yours

Customize the practice

Choose your options, update the preview, then download the exact same pages.

Choose the leading coefficients and opening directions, then change the seed for four new inequalities with the same balanced relation schedule.

Worksheet settings

Page note and reproducible seed

The same settings and seed make the same questions. Shared links include your page note; leave personal information out. Notes use the selected language’s supported characters; English accepts basic Latin text.

Configured PDF · Graphing Quadratic Inequalities · US Letter

Preview ready. Download includes these exact pages.

1 student page
Enlarged pages scroll. PDF size stays the same.
Math SheetNameScore/ 4TeacherDateGraphing Quadratic InequalitiesGraph each quadratic inequality. Draw the boundary, then shade the solution region.1.y-x2+2·x+3-10-10-5-50551010xy2.y3·x2+24·x+46-10-10-5-50551010xy3.yx2-8·x+16-10-10-5-50551010xy4.y-2·x2+8·x-5-10-10-5-50551010xymath-sheet.comPage 1 / 1

A useful next step

Related activities

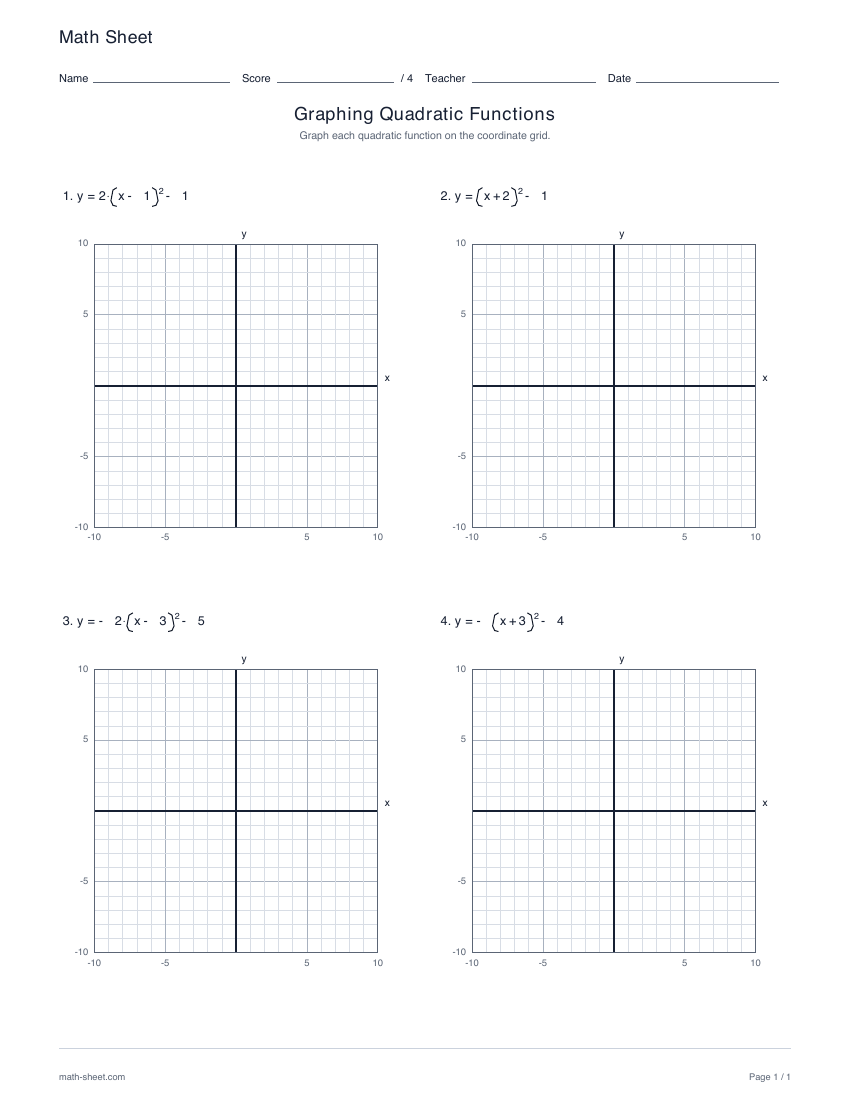
First page preview: Graphing quadratic functions worksheets

General functions

Graphing quadratic functions worksheets

Graph four quadratic functions in vertex form on blank coordinate grids. Each sheet includes every leading coefficient from −2, −1, 1 and 2, with a separate completed graph key.

Preview and download
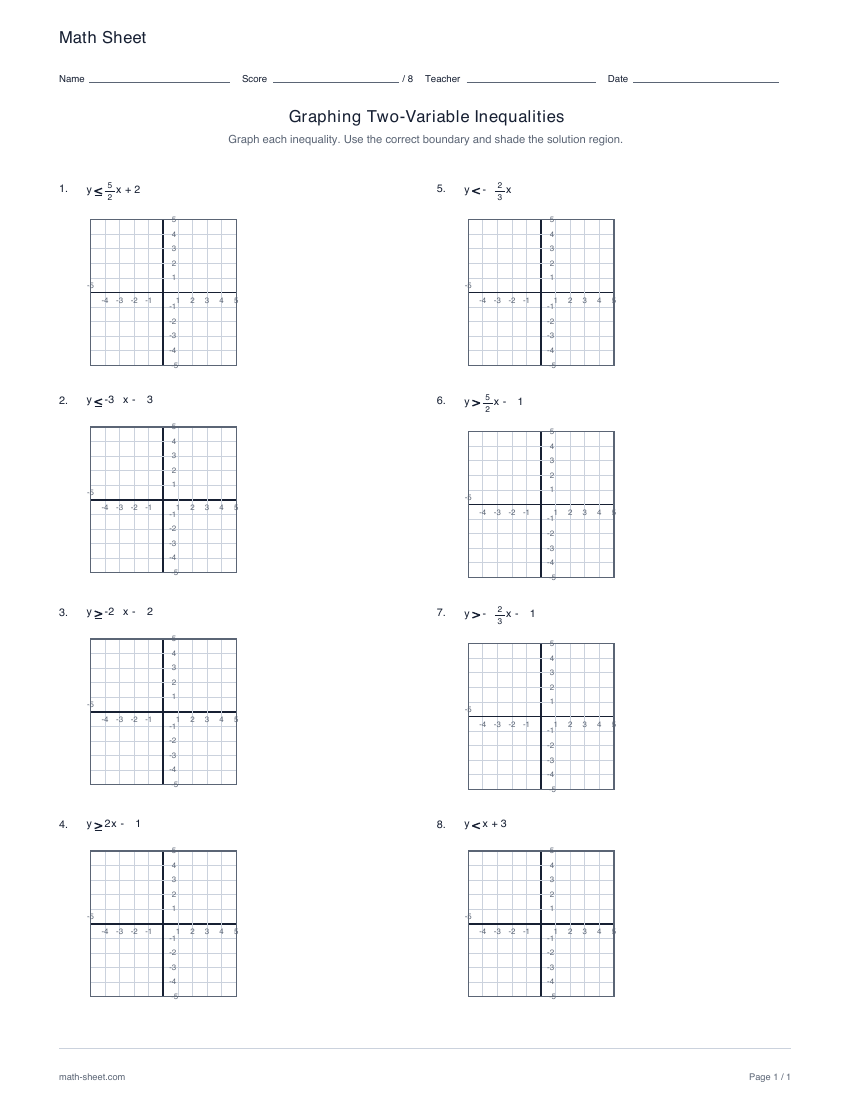
First page preview: Graphing two-variable inequalities worksheets

Linear functions

Graphing two-variable inequalities worksheets

Graph eight linear inequalities on coordinate planes. Select any nonempty combination of <, ≤, > and ≥, then draw the boundaries and shade the solution regions with a separate graphical key.

Preview and download
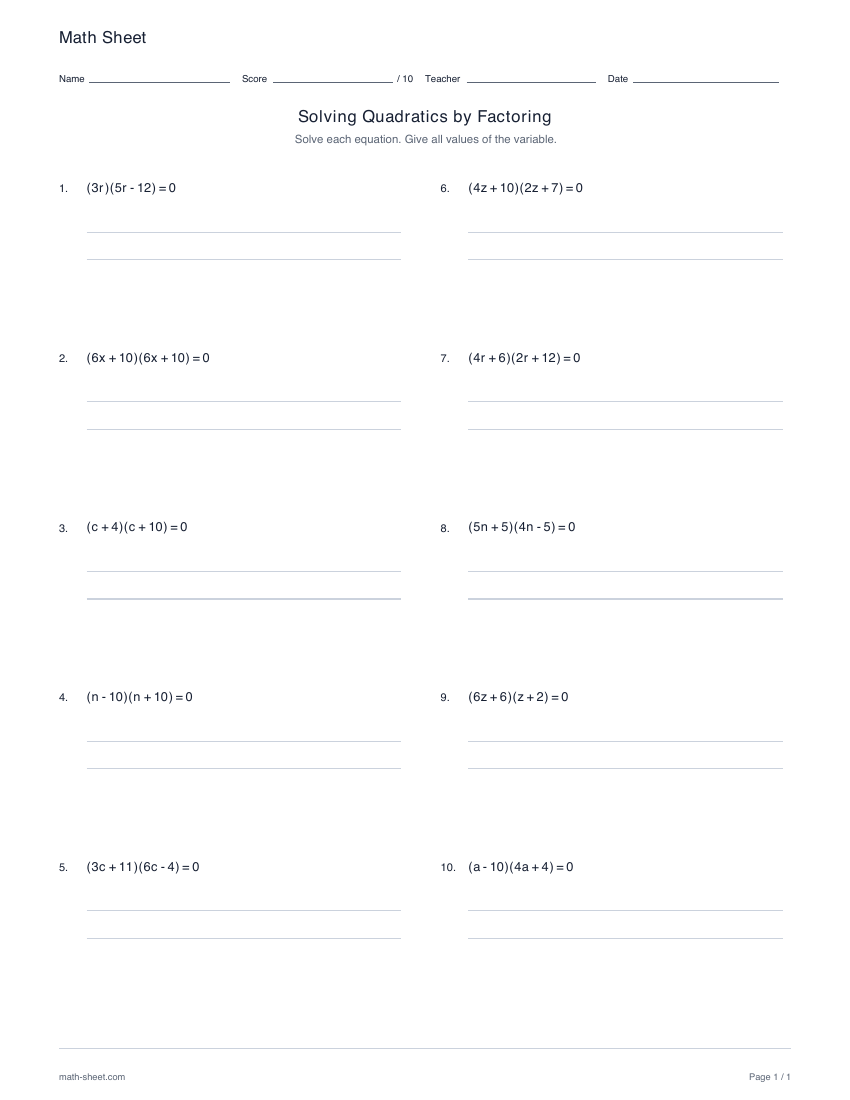
First page preview: Solving quadratics by factoring worksheets

Equations

Solving quadratics by factoring worksheets

Solve ten factorable quadratic equations with complete exact root sets. Choose factored form, expanded form, rearrangement practice or a balanced mixed sheet.

Preview and download