
Linear functions
Graphing slope-intercept form worksheets
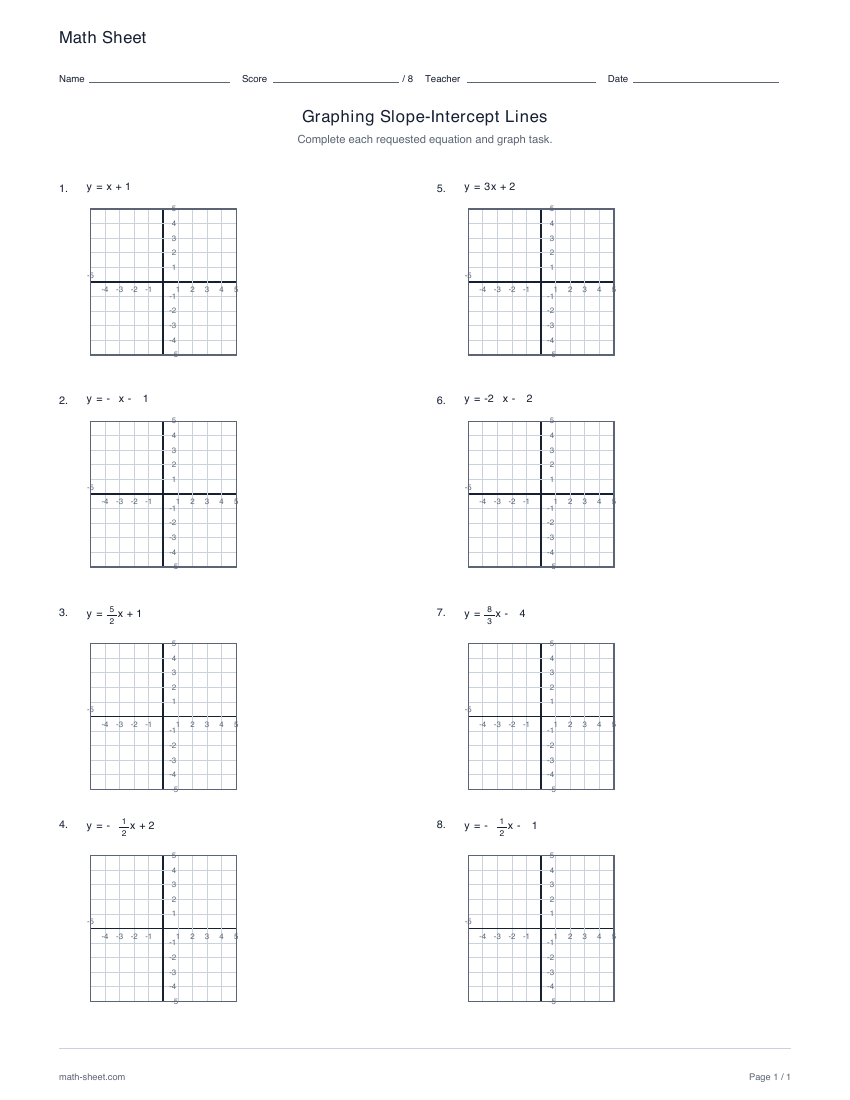
Graph eight lines in slope-intercept form. Choose graphing alone, graphing with slope and intercept questions, or writing an equation and graph from supplied properties.
Preview and downloadLinear functions practice
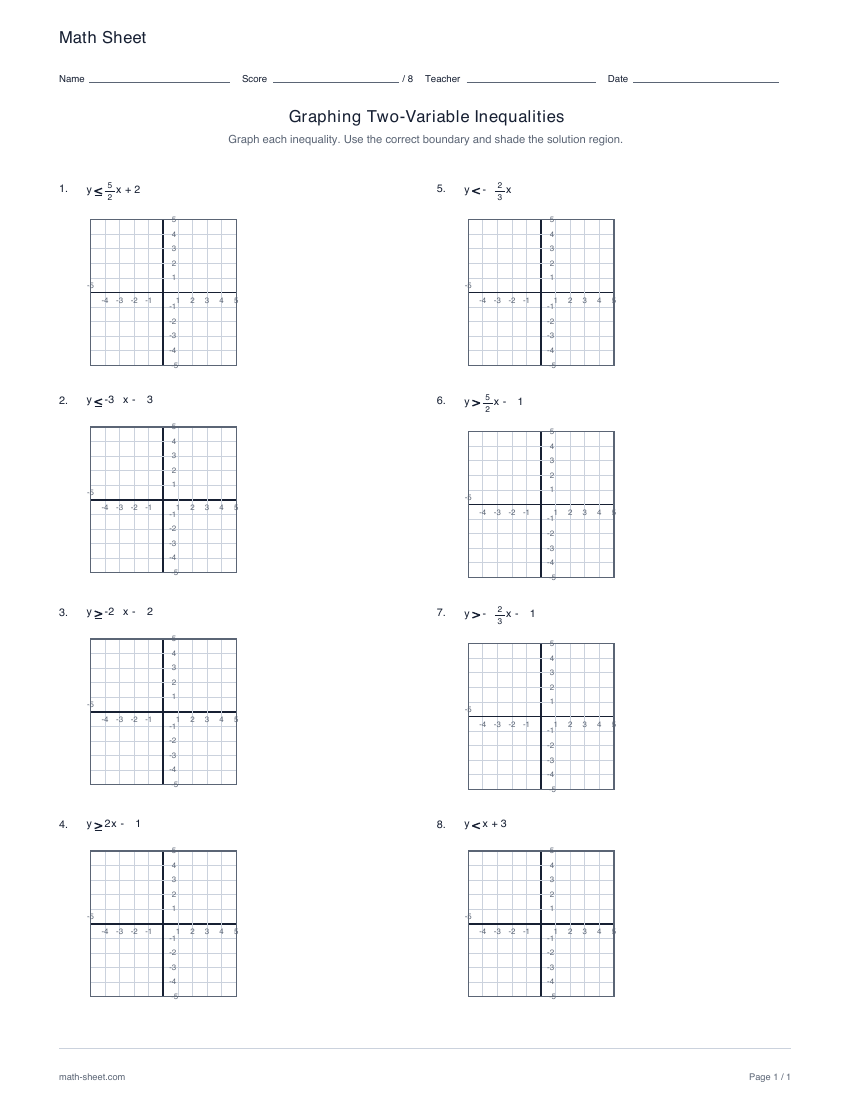
Graph eight linear inequalities on coordinate planes. Select any nonempty combination of <, ≤, > and ≥, then draw the boundaries and shade the solution regions with a separate graphical key.
Ready-made English PDF · fixed settings
Customization below makes a separate PDF.
Fixed English ready-made files. Custom settings below apply only to the configured PDF.
Ready to print
Draw the boundary line, dashed for a strict comparison and solid when equality is allowed. Test a point off the boundary and shade the matching side.
Download the practice pages alone, or include a separate answer key or teacher model. Longer activities may use more than one page.
Customize this worksheetPaper sizes and printing help · More linear functions activities
Each of the eight prompts describes a set of ordered pairs. The answer key shows a dashed boundary for a strict comparison or a solid boundary when equality is allowed, together with the correct shaded half-plane.
Test a point away from the boundary before choosing the shaded side. The boundary style and the region each carry part of the mathematical meaning.
Learning objective
Represent all ordered pairs satisfying a linear inequality with a boundary and a half-plane.
Worked example
Draw a solid line through (0, 2) and (4, 0), then shade below it.
Equality is included, so the boundary is solid. The test point (0, 0) satisfies 0 ≤ 2, so shade the side containing the origin. The solution contains ordered pairs, not a one-dimensional ray.
Teaching notes
Make it yours
Choose your options, update the preview, then download the exact same pages.
Choose one or more comparison signs for eight graphing questions. Every grid uses unit intervals from −5 to 5.
A useful next step
Linear functions
Graph eight lines in slope-intercept form. Choose graphing alone, graphing with slope and intercept questions, or writing an equation and graph from supplied properties.
Preview and download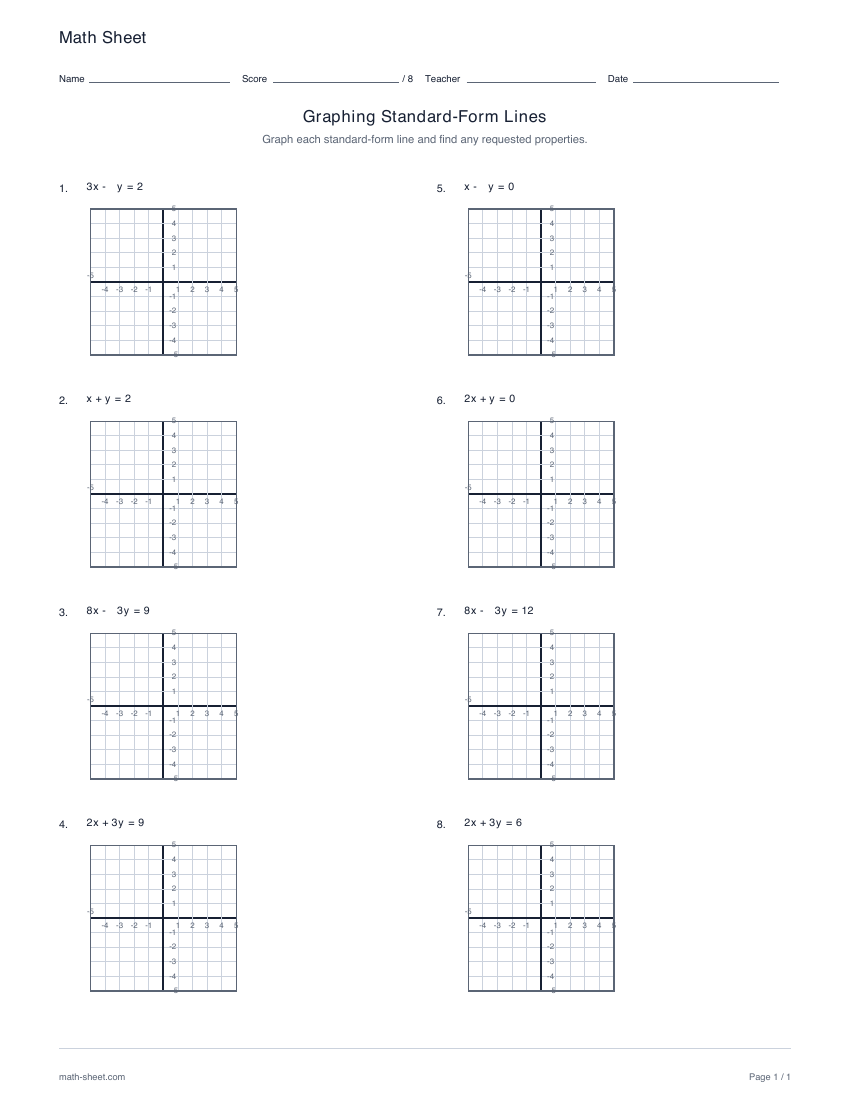
Linear functions
Graph eight equations in standard form Ax + By = C. Choose graphing alone or also find slope and label the y-intercept, using exact fractional slopes and worked keys.
Preview and download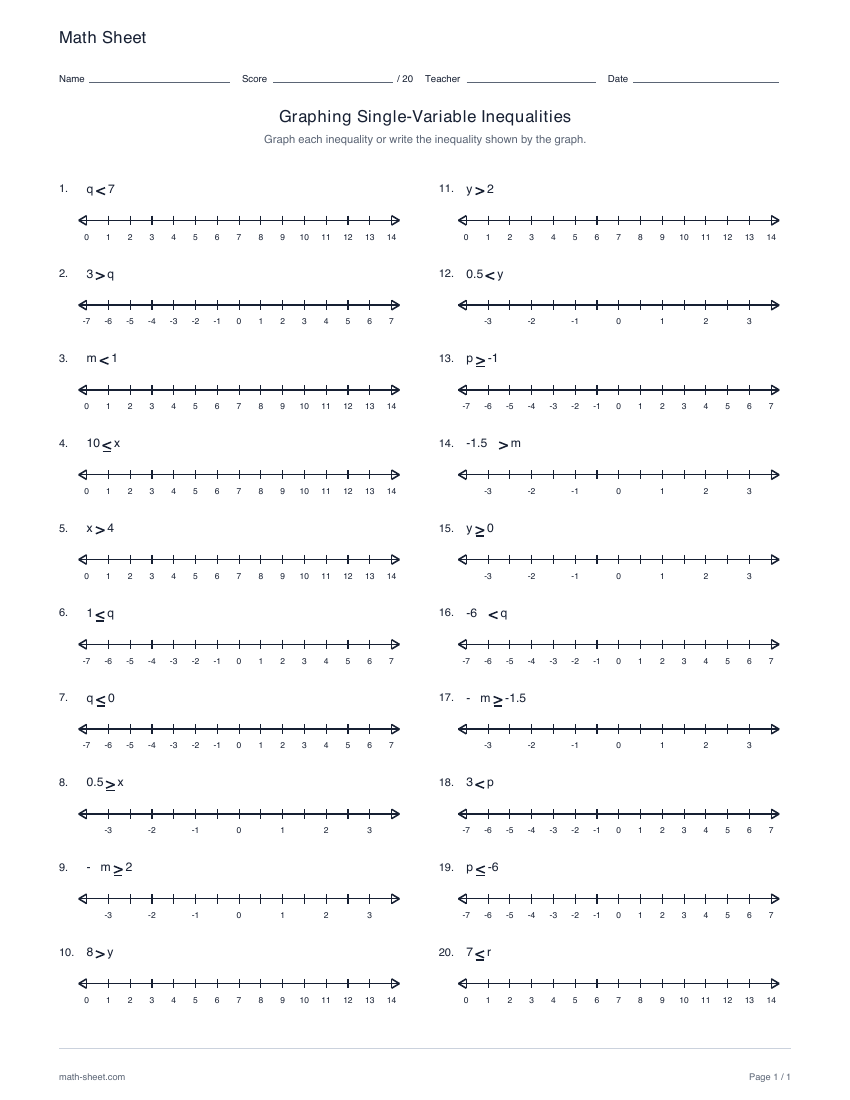
Inequalities
Translate between an inequality and a number-line graph in twenty questions. Choose whole numbers, signed integers or halves; draw graphs, read graphs or mix both tasks, with a separate key.
Preview and download