
Linear functions
Finding slope from graphs worksheets
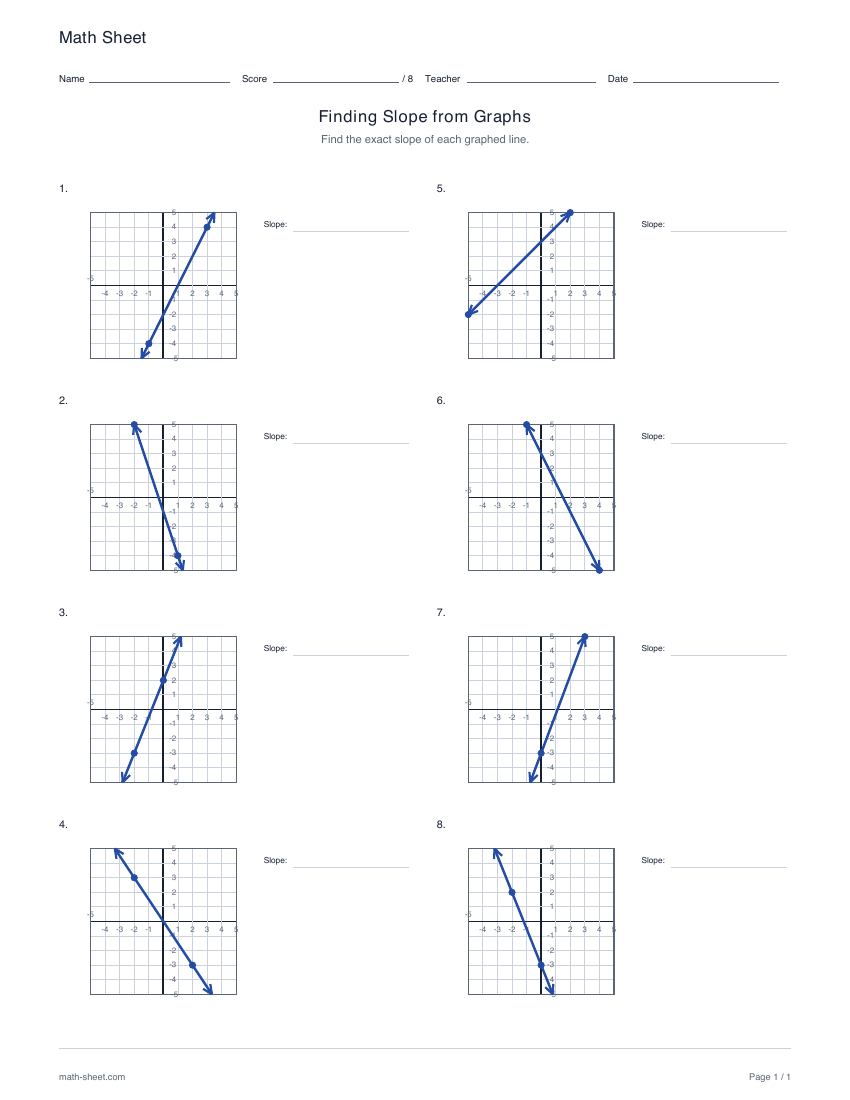
Read eight graphed lines and find each exact slope. Use the coordinate scale to compare rise and run, then check a separate answer key with worked calculations.
Preview and downloadOne relationship, several ways to see it
Find a slope, read an intercept, write an equation and draw its graph. Connect these skills with focused practice, then extend a line into the solution region of an inequality.
Choose a worksheetFrom points to an equation
Connect a value, an equation and a graph
Read a line on a graph, calculate a rate of change from points, then identify the same property in an equation.
Linear functions
Read eight graphed lines and find each exact slope. Use the coordinate scale to compare rise and run, then check a separate answer key with worked calculations.
Preview and download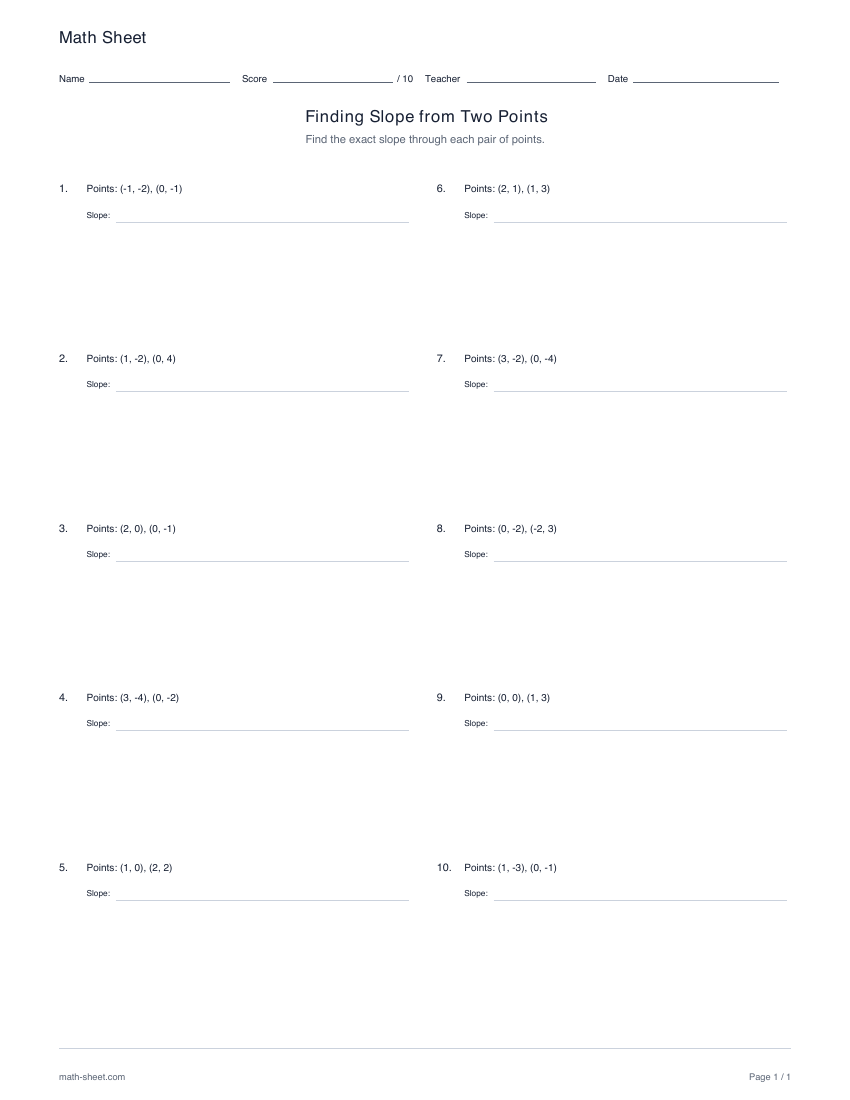
Linear functions
Calculate exact slopes from ten pairs of integer-coordinate points. Practice signed differences and reduced fractions, with a separate key that explains the slope calculation.
Preview and download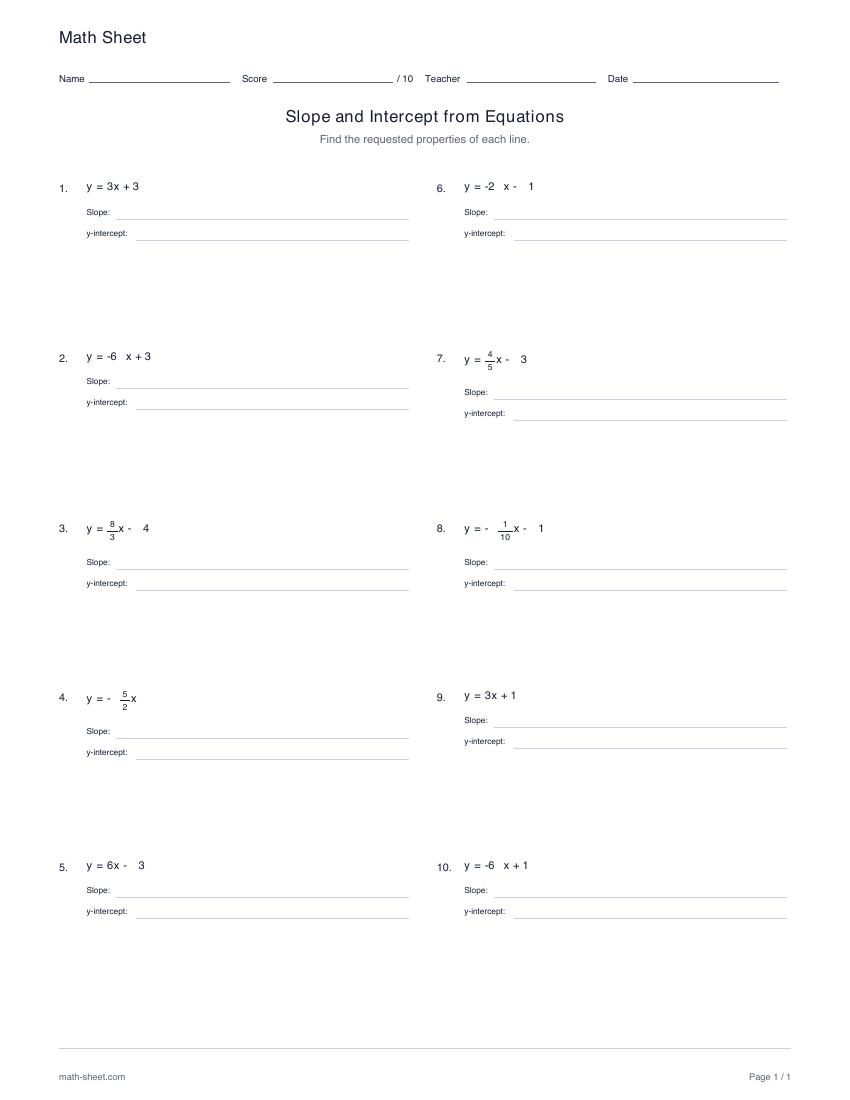
Linear functions
Find slope and y-intercept in ten linear equations. Choose slope-intercept form, standard form or both, and practice slope alone or both properties with exact answers.
Preview and downloadConnect a value, an equation and a graph
Use an equation, an intercept and point, or two points to draw the same kind of mathematical object: a complete straight line.
Linear functions
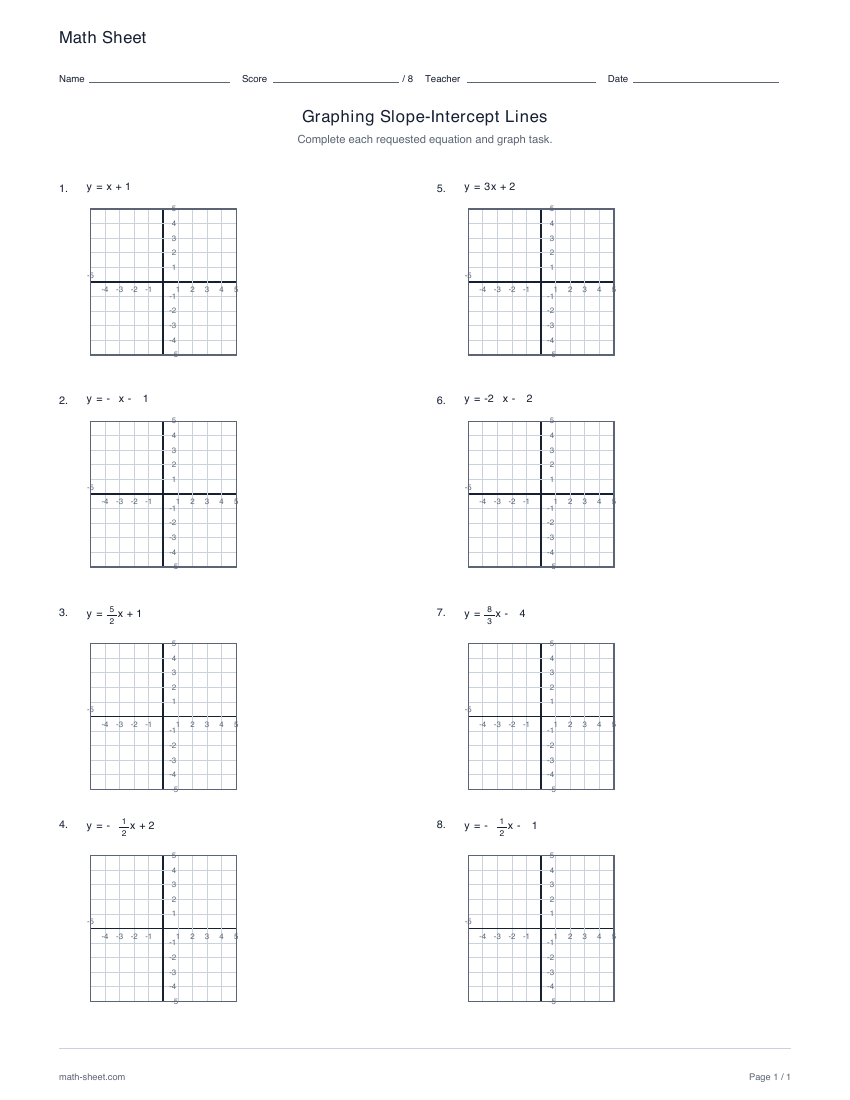
Graph eight lines in slope-intercept form. Choose graphing alone, graphing with slope and intercept questions, or writing an equation and graph from supplied properties.
Preview and download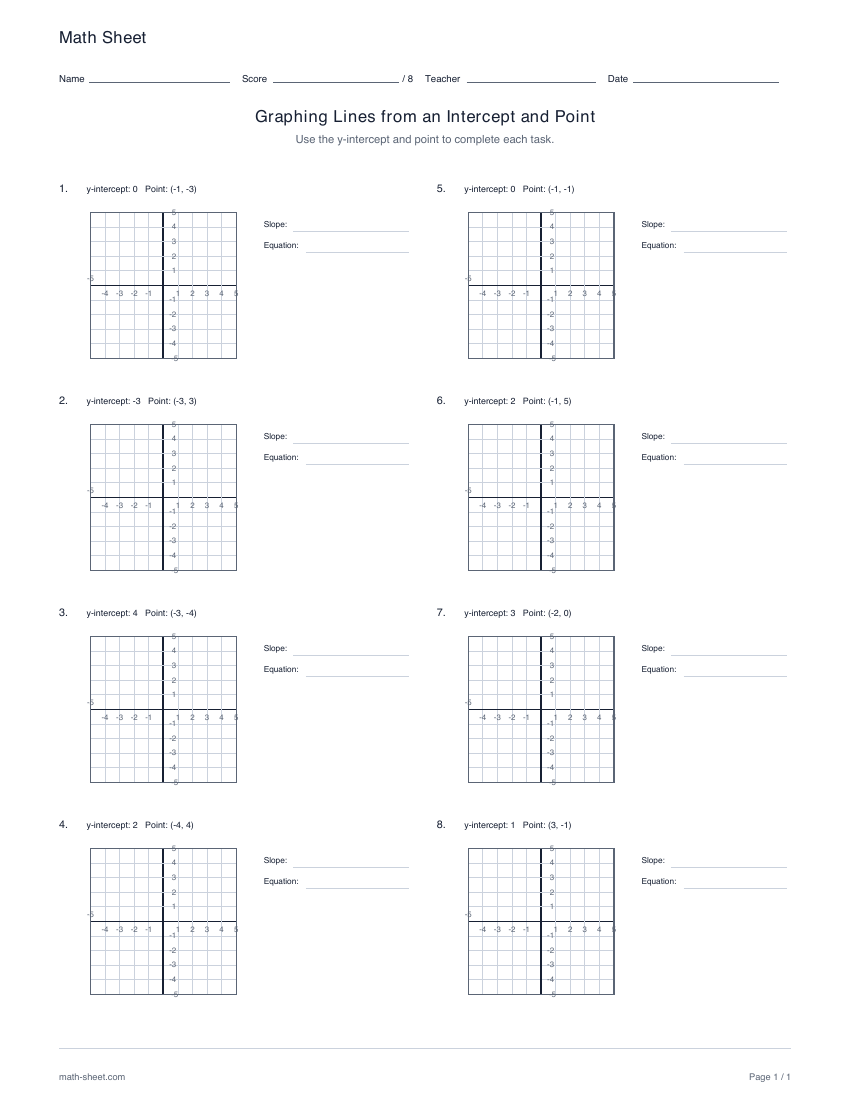
Linear functions
Construct eight lines from a supplied y-intercept and one ordered pair. Choose graphing alone or also find the slope and equation, with worked keys and completed graphs.
Preview and download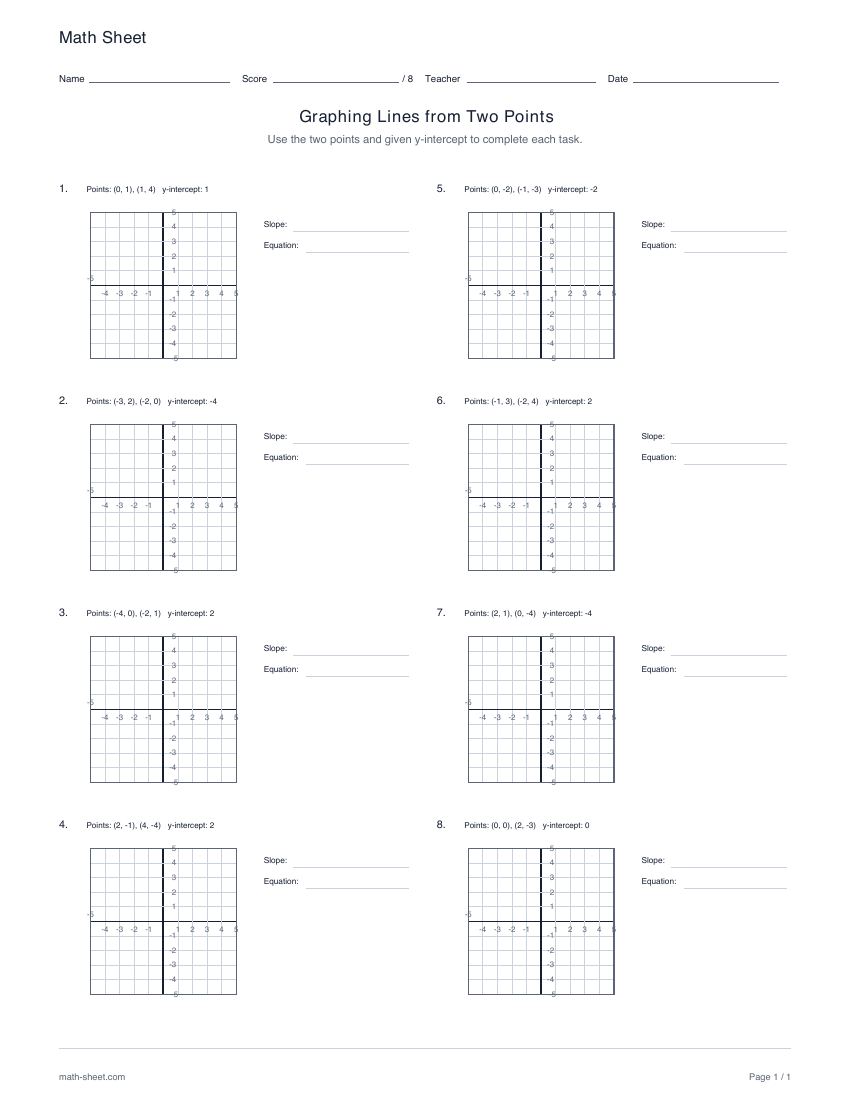
Linear functions
Graph eight lines using two ordered pairs and a supplied y-intercept. Choose graphing alone or also calculate the slope and write an equation, with separate worked answers.
Preview and download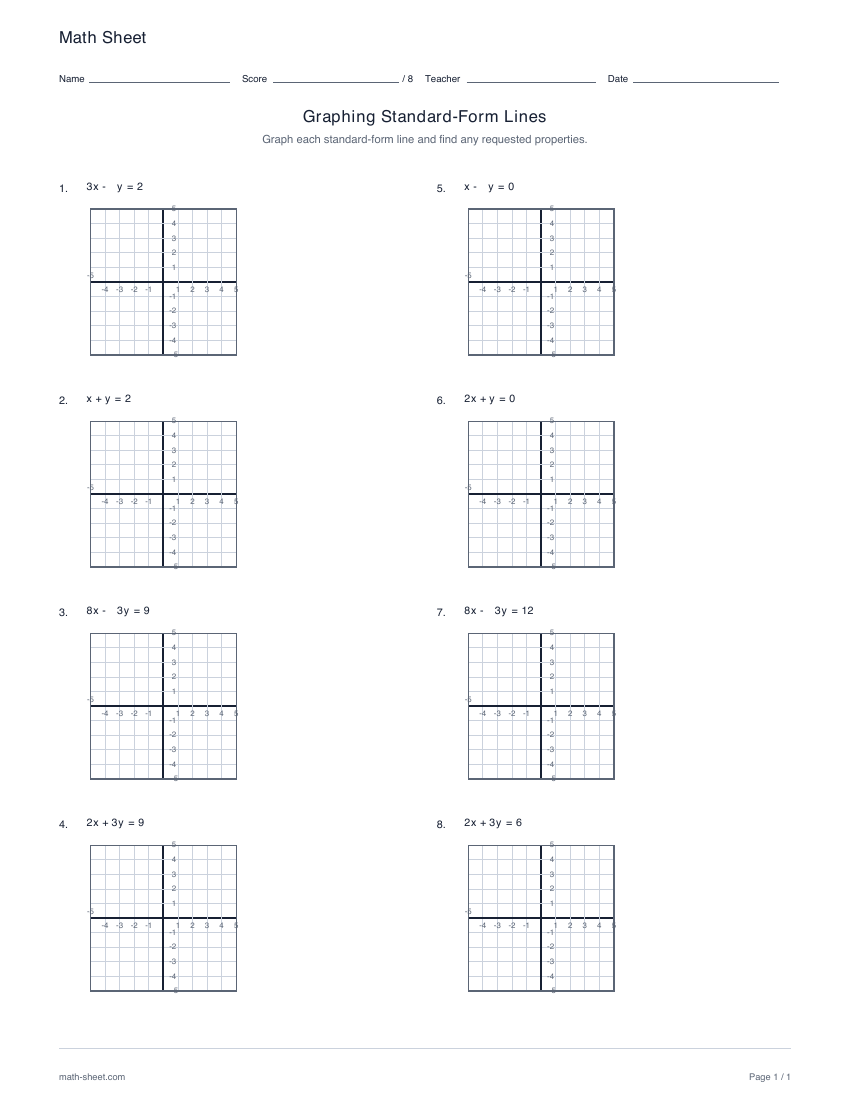
Linear functions
Graph eight equations in standard form Ax + By = C. Choose graphing alone or also find slope and label the y-intercept, using exact fractional slopes and worked keys.
Preview and downloadConnect a value, an equation and a graph
Write equations from visible graphs or combine several representations in one mixed practice set.
Linear functions
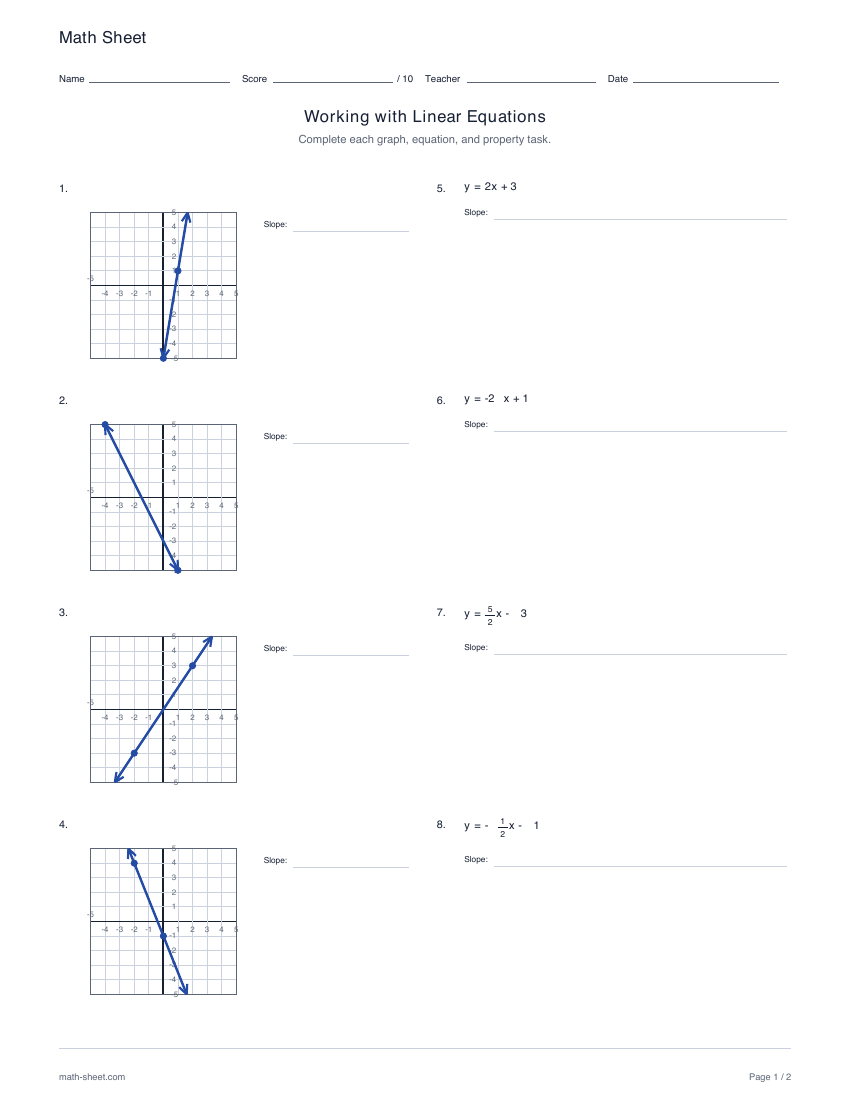
Connect graphs, equations and line properties in ten tasks: four graph-to-slope questions, four equation-to-slope questions and two write-and-graph problems.
Preview and download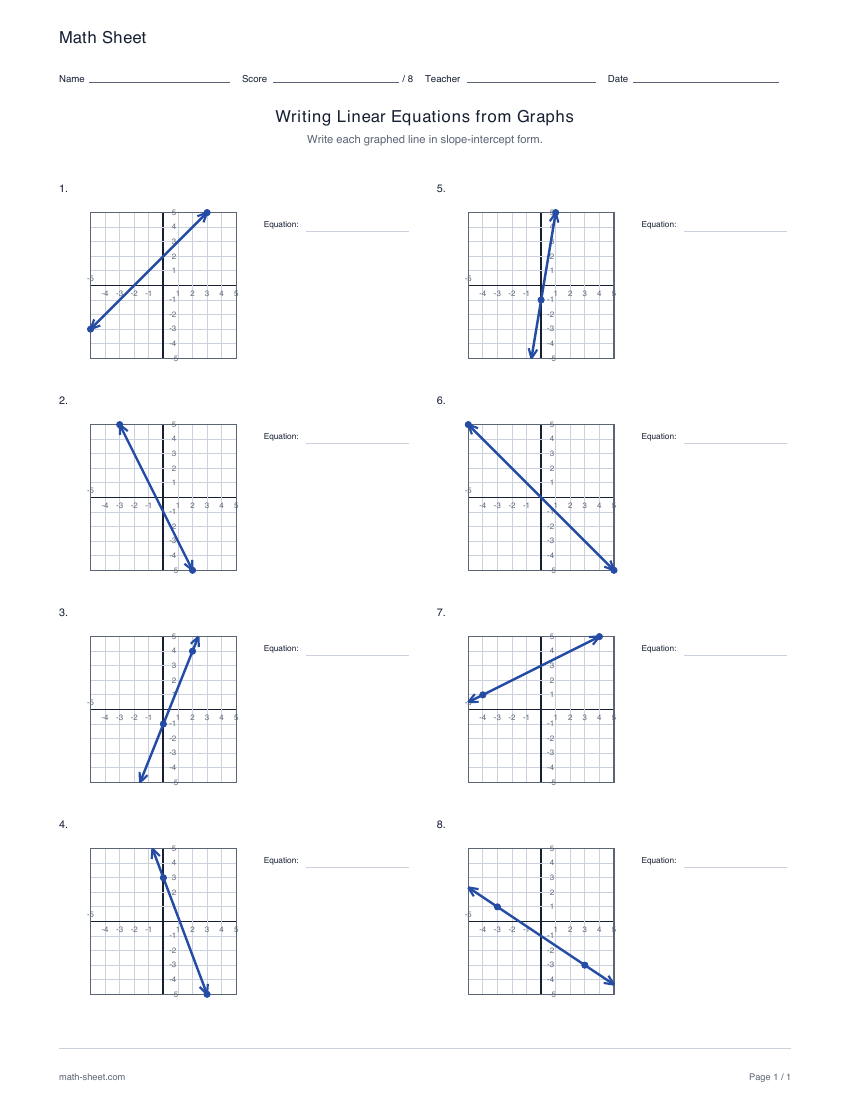
Linear functions
Write slope-intercept equations for eight graphed lines. Read the y-intercept, calculate an exact slope and check the equation against visible points with a separate worked key.
Preview and downloadConnect a value, an equation and a graph
Use a boundary line and a shaded half-plane to describe the ordered pairs that satisfy a two-variable inequality.
Linear functions
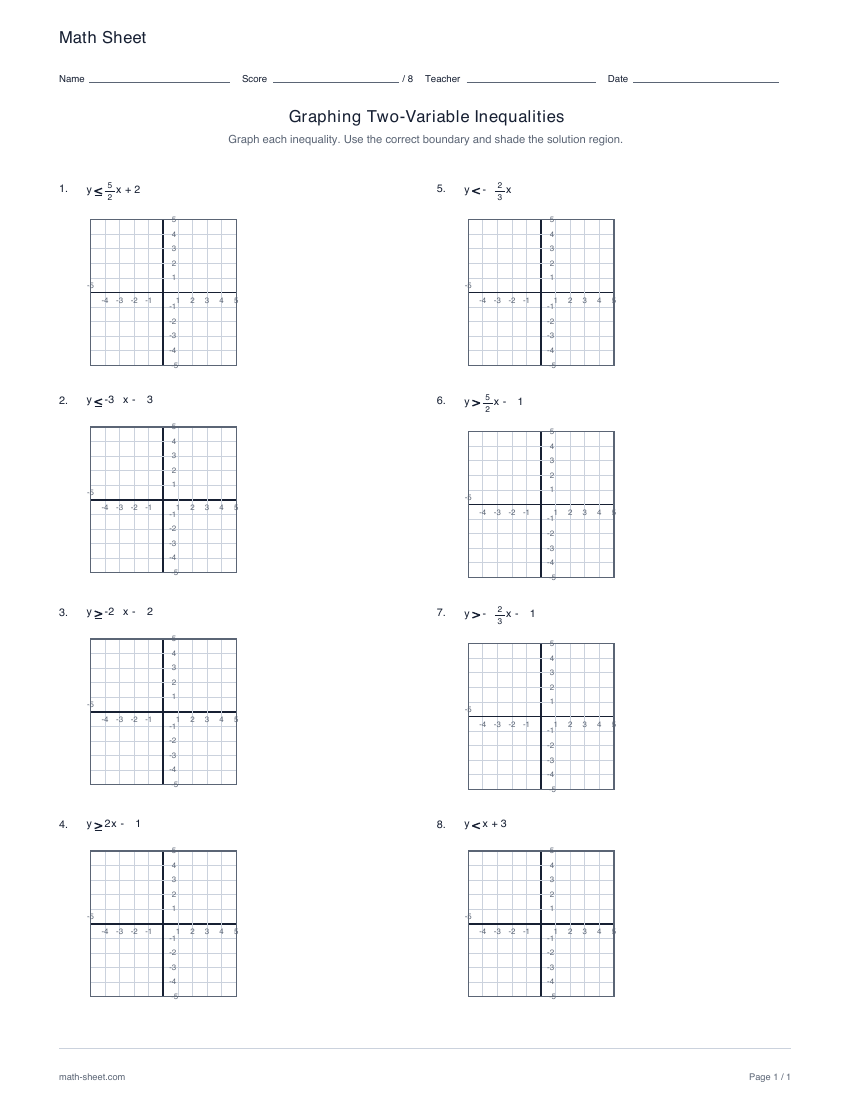
Graph eight linear inequalities on coordinate planes. Select any nonempty combination of <, ≤, > and ≥, then draw the boundaries and shade the solution regions with a separate graphical key.
Preview and downloadConnect a value, an equation and a graph
Extend coordinate graphing to translations and reflections of absolute value functions. Read a vertex and opening direction, or construct the two branches from an equation.
Linear functions
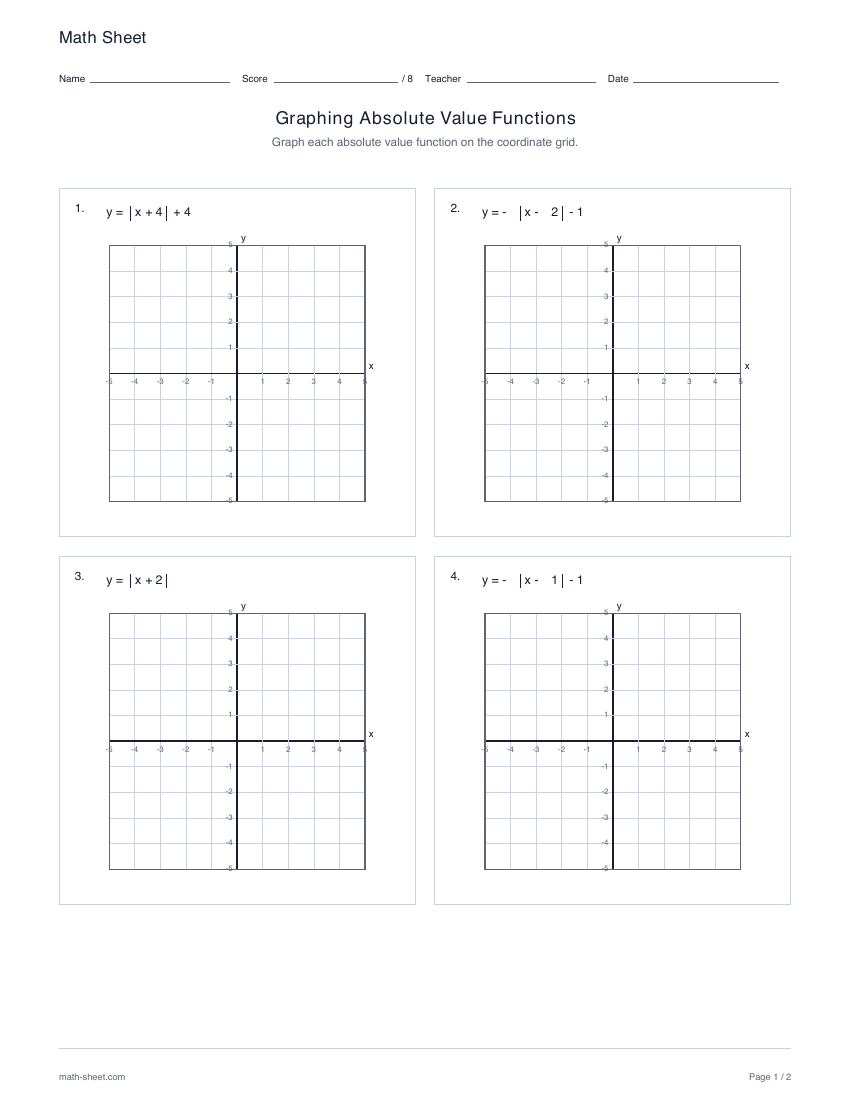
Graph eight absolute value functions or write equations from eight V-shaped graphs. Practice translations and reflections of y = |x| with integer vertices and a separate worked graphical key.
Preview and downloadCoordinate reading, signed subtraction and fraction fluency are separate prerequisites. Use a focused task to find which connection needs practice before choosing a mixed worksheet.
Begin after coordinate plotting and signed subtraction are secure. Compare vertical and horizontal changes between two points.
Open this starting point →Start with y already isolated so the learner can connect its coefficient and constant with a graph.
Open this starting point →Write the equation and graph it from supplied properties, keeping each representation connected.
Open this starting point →Mix standard and slope-intercept forms after equivalent transformations and fractions are familiar.
Open this starting point →The slope describes a change between points. The y-intercept is where the line meets the y-axis. In y = mx + b, m gives the slope and b gives the intercept value; (0, b) is the corresponding point.
For y = −2x + 3, the line crosses the y-axis at (0, 3). Moving one unit right lowers y by two. Both (1, 1) and (2, −1) lie on the same line. Check those coordinates before relying on how steep a picture looks.
These practice sets use finite, nonzero slopes. More generally, a horizontal line has slope zero, while a vertical line has undefined slope and cannot be written as y = mx + b.
2x + 3y = 6 and y = −(2/3)x + 2 describe the same ordered pairs. Rearranging changes how the equation is written; it does not move its graph. A line drawn from either form should pass through (0, 2) and (3, 0).
Have learners check one point in the original equation after they convert it. This catches sign and division mistakes more reliably than comparing two final formulas by appearance.
Build a table of values before plotting the coordinate pairs and looking for a constant rate of change.
Function tables →Practice inverse operations and signed fractions before isolating y in a standard-form equation.
Equation practice →Use expressions, equations and comparisons as a foundation for line relationships.
Pre-algebra sequence →