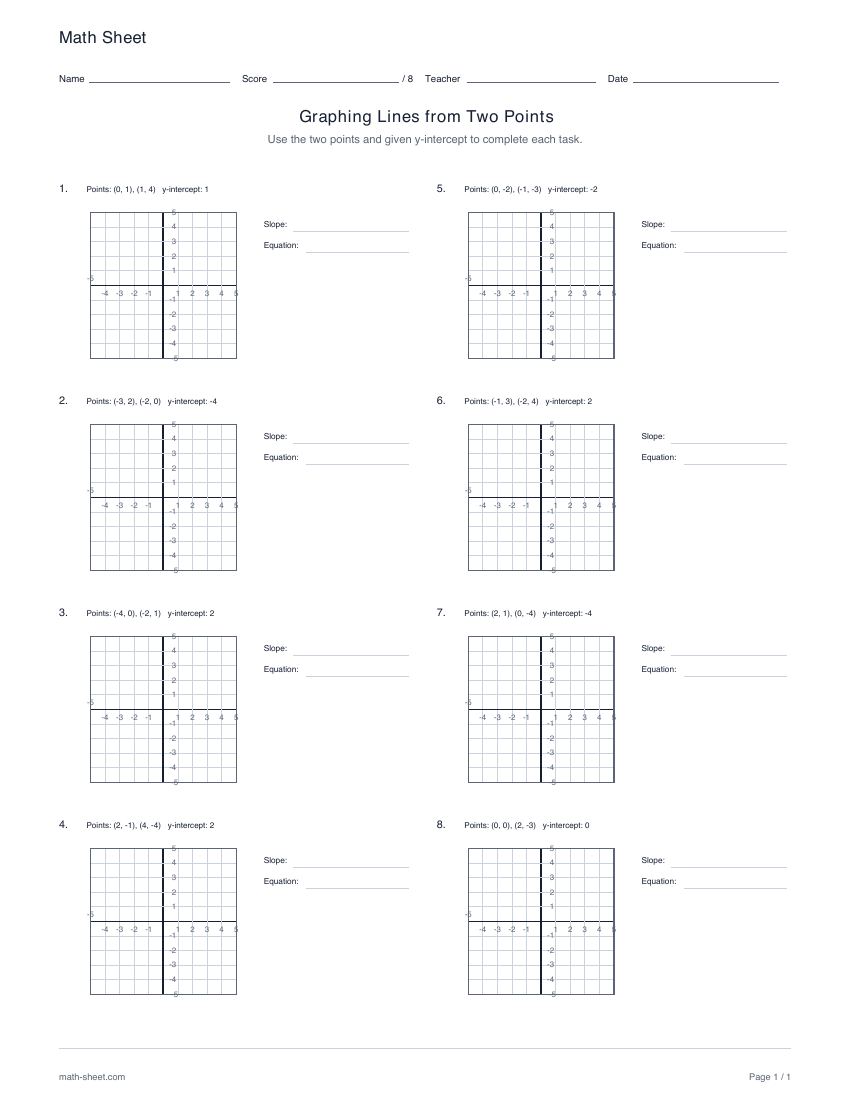
Graph eight lines using two ordered pairs and a supplied y-intercept. Choose graphing alone or also calculate the slope and write an equation, with separate worked answers.
Work with exact slopes and intercepts. Coordinate graphs use unit intervals from −5 to 5 on both axes, and the worked key connects the given information to the requested values, equation or completed graph.
Both modes provide two ordered pairs and their y-intercept. Graph-only mode focuses on drawing the line; the other mode also asks for its slope and equation.
Learning objective
What this activity builds
Connect point data, an intercept and an equation that describe the same line.
Worked example
A line passes through (−2, −3) and (2, 3), with y-intercept 0. Find its equation.
m = (3 − (−3))/(2 − (−2)) = 3/2, so y = (3/2)x.
Both points give the same line and the supplied intercept confirms it passes through the origin. Substituting either pair verifies the equation.
Teaching notes
Make the practice count
Keep each ordered pair together while plotting.
Use the given intercept as an independent graph check.
Calculate slope in a consistent point order.
Extend the line across the coordinate window.
Make it yours
Customize the practice
Choose your options, update the preview, then download the exact same pages.
Every coordinate grid uses the fixed −5 to 5 unit window. Graph-only modes omit computed response fields; answer editions complete every requested line or solution region.
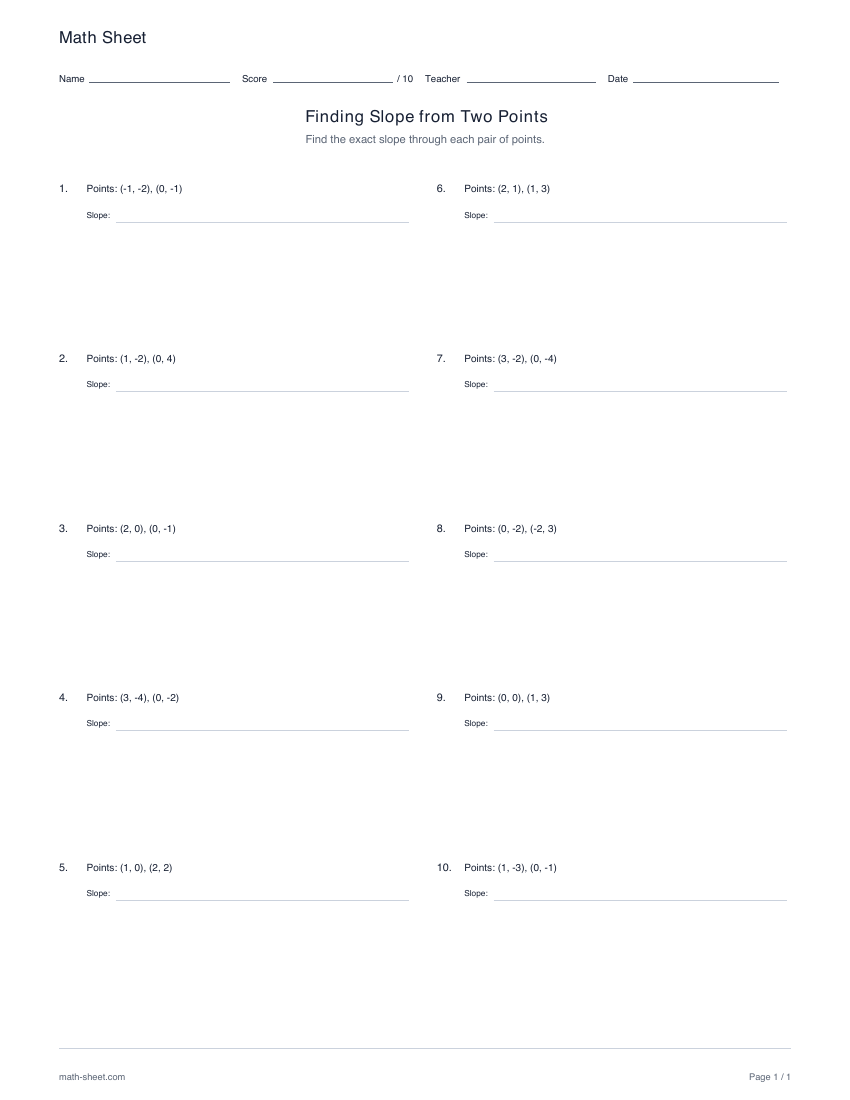
Calculate exact slopes from ten pairs of integer-coordinate points. Practice signed differences and reduced fractions, with a separate key that explains the slope calculation.
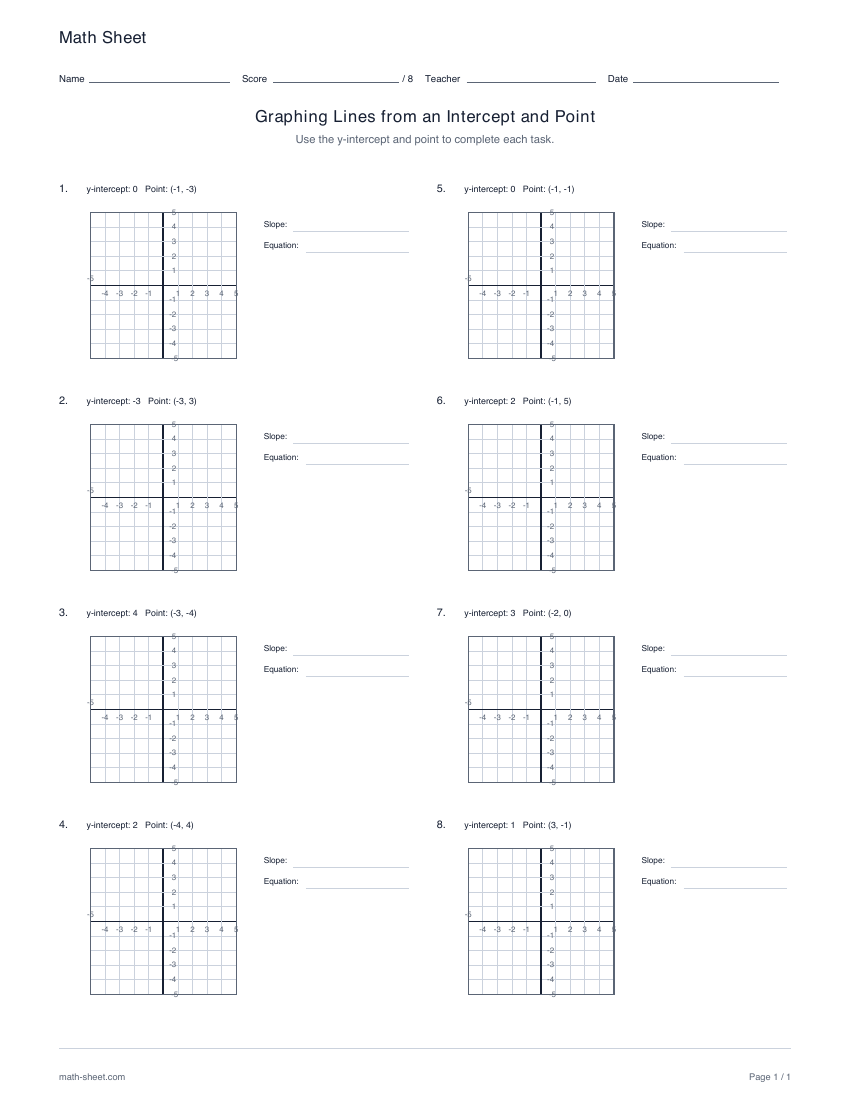
Construct eight lines from a supplied y-intercept and one ordered pair. Choose graphing alone or also find the slope and equation, with worked keys and completed graphs.
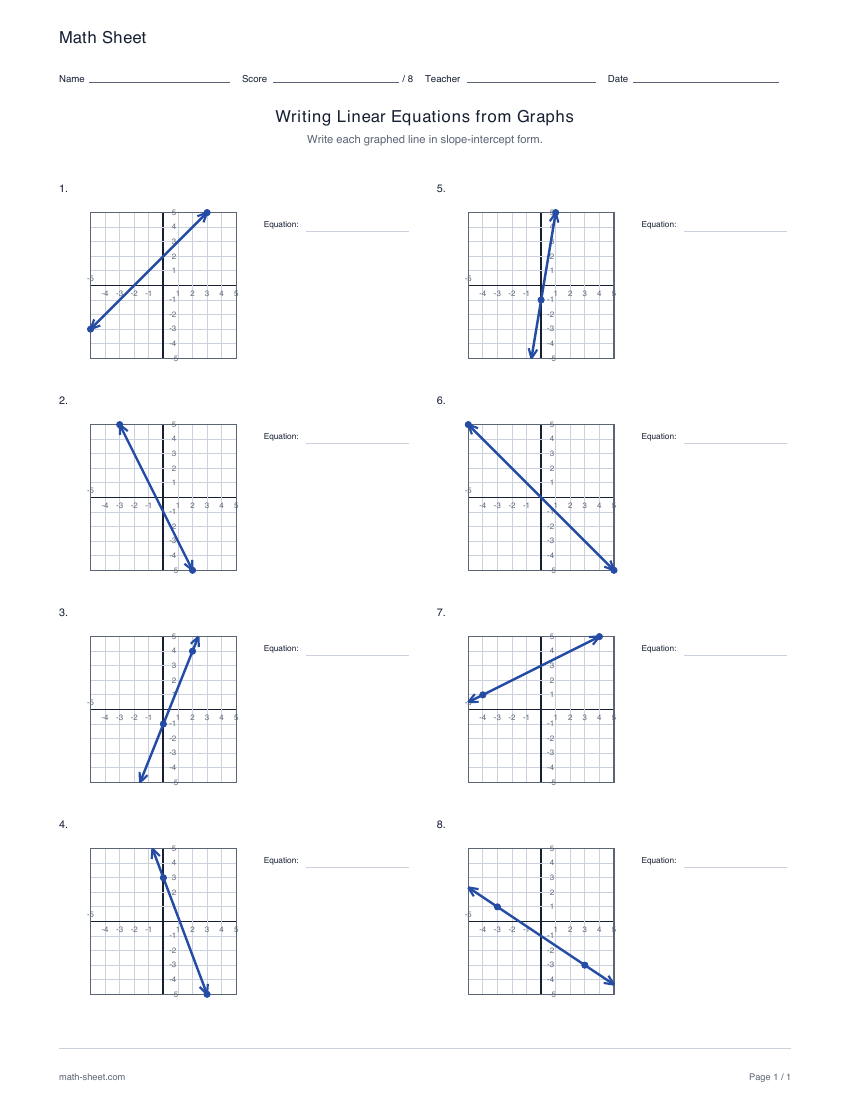
Write slope-intercept equations for eight graphed lines. Read the y-intercept, calculate an exact slope and check the equation against visible points with a separate worked key.