
General functions
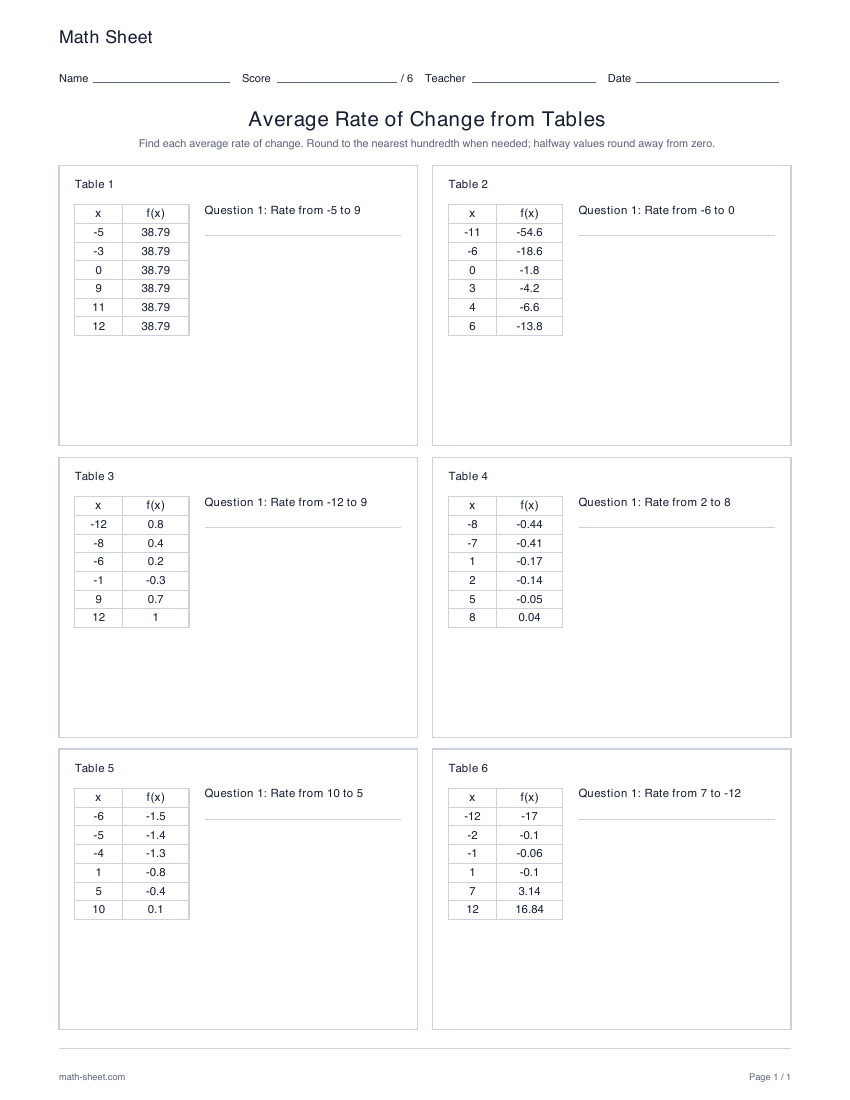
Average rate of change from tables worksheets
Find average rates from six function tables. Choose 6 or 12 questions, print Letter or A4, and check each result with a separate worked answer key.
Preview and downloadGeneral functions practice
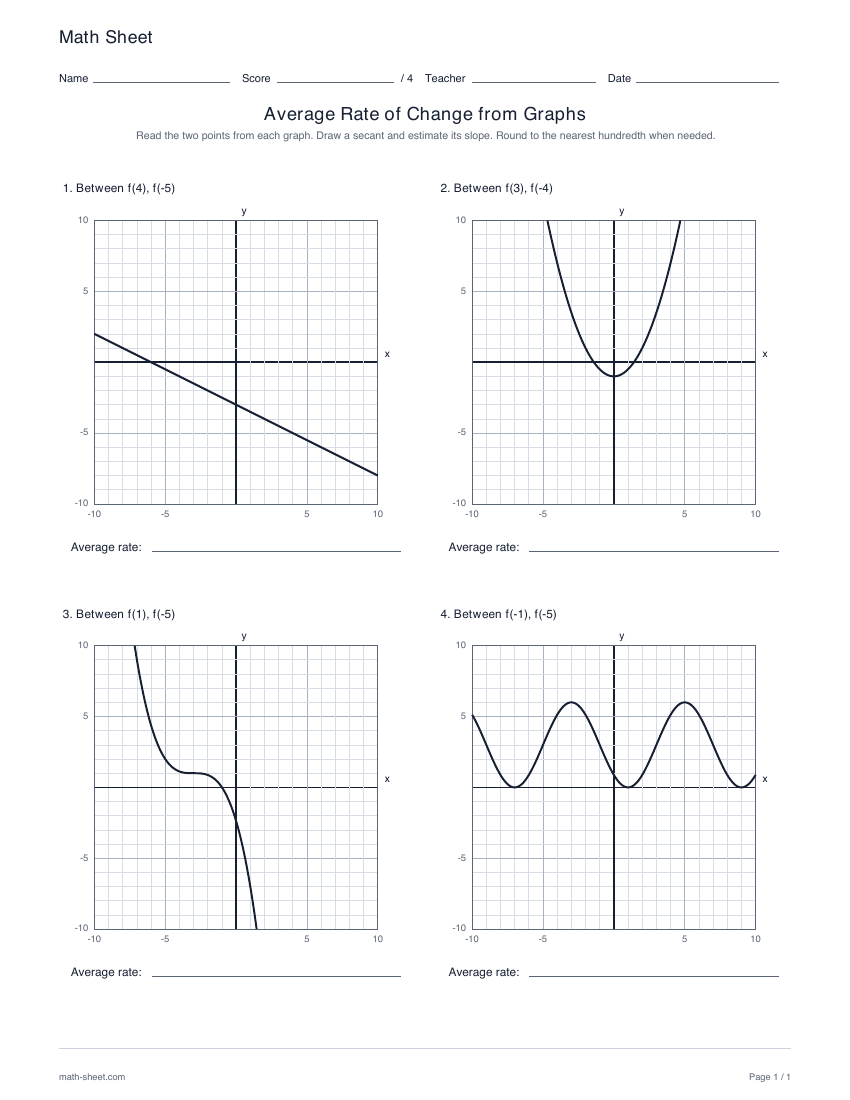
Read four function graphs and estimate their average rates of change. Choose linear, quadratic, cubic, sine or exponential curves, with secants and worked answers.
Ready-made English PDF · fixed settings
Customization below makes a separate PDF.
Fixed English ready-made files. Custom settings below apply only to the configured PDF.
Ready to print
Locate the two requested inputs and read their outputs from the curve. Join the points with a straight secant, then divide the change in output by the change in input.
Download the practice pages alone, or include a separate answer key or teacher model. Longer activities may use more than one page.
Customize this worksheetPaper sizes and printing help · More general functions activities
Choose the curve for each of four questions independently: linear, quadratic, cubic, sine or exponential. Every graph has a unit grid from −10 to 10 on both axes, with room to draw a secant and write the average rate.
The student sheet gives two inputs without marking the points or revealing a formula. Read the outputs from the curve. The selected points lie on whole or half units so learners can check them against the grid.
The separate key marks both points with open circles, joins them with a blue secant and shows their coordinates and the substituted quotient. Reference values use exact endpoints and round to the nearest hundredth when needed. Allow reasonable graphical estimates when marking.
Learning objective
Read two points from a function graph and use the slope of their secant to describe average change over an interval.
Worked example
(−1 − 5) ÷ (4 − (−2)) = −6 ÷ 6 = −1.
The secant goes down 6 units as it moves right 6 units. Its slope is −1, even if the curve rises or bends elsewhere between the points.
Teaching notes
Make it yours
Choose your options, update the preview, then download the exact same pages.
Choose the practice settings, update the preview and print the same questions with a separate answer key.
A useful next step
General functions
Find average rates from six function tables. Choose 6 or 12 questions, print Letter or A4, and check each result with a separate worked answer key.
Preview and download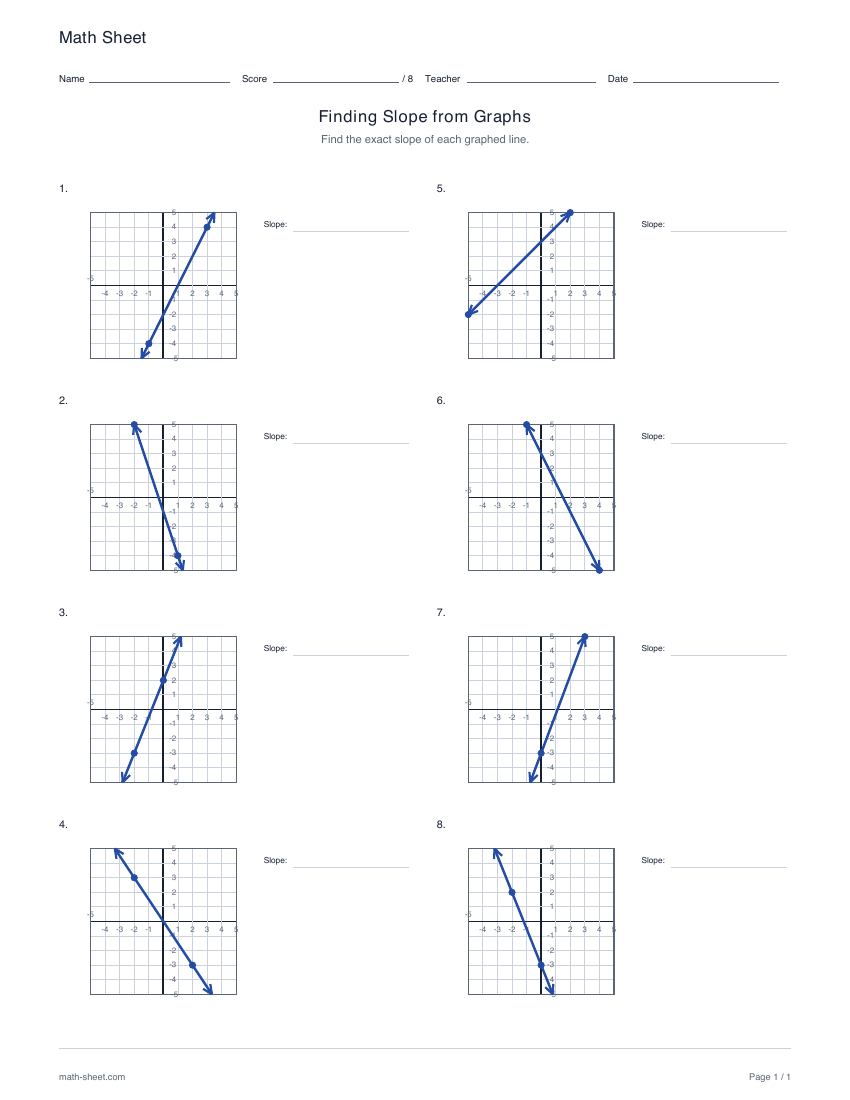
Linear functions
Read eight graphed lines and find each exact slope. Use the coordinate scale to compare rise and run, then check a separate answer key with worked calculations.
Preview and download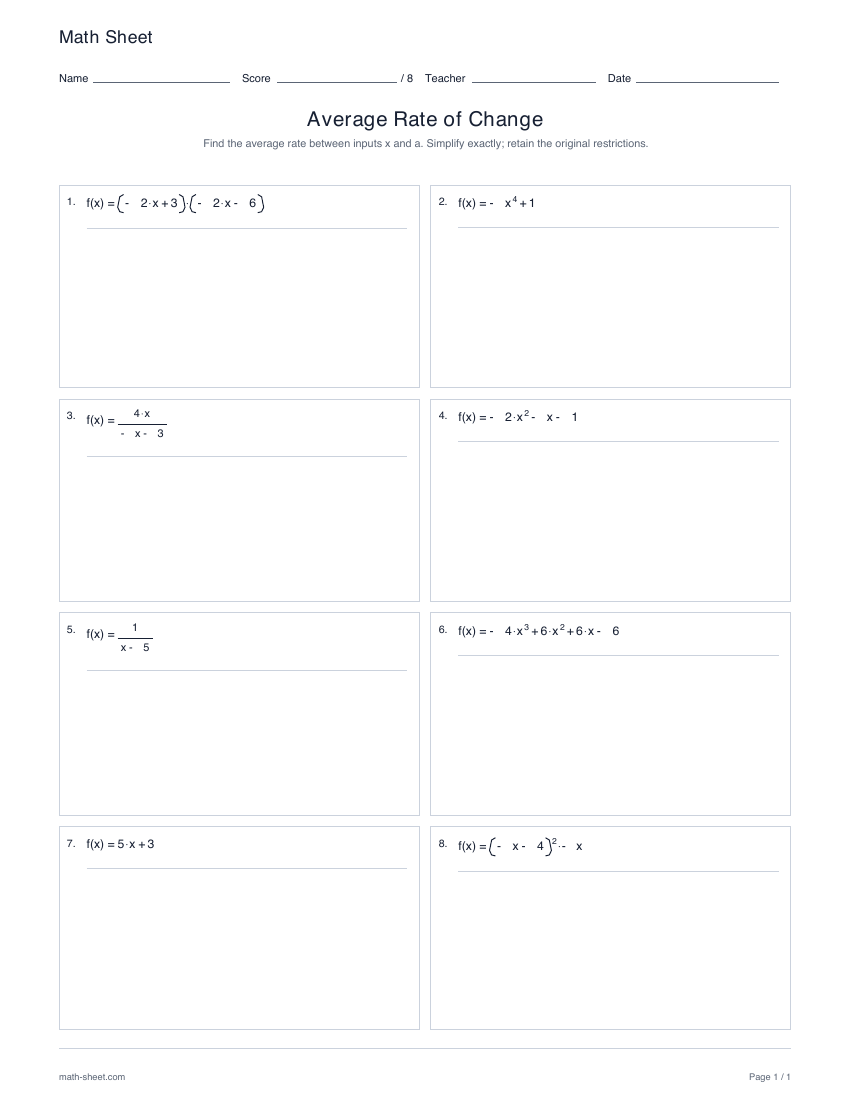
General functions
Simplify eight difference quotients with polynomial, factored and rational functions. Choose two inputs or an increment, add a formula reminder and print worked answers.
Preview and download