General functions practice

Average rate of change from tables worksheets

Find average rates from six function tables. Choose 6 or 12 questions, print Letter or A4, and check each result with a separate worked answer key.

Ready-made English PDF · fixed settings

Customization below makes a separate PDF.

Fixed English ready-made files. Custom settings below apply only to the configured PDF.

Ready to print

Start with a ready-made worksheet

Find the two requested rows. Subtract their outputs in the same order as their inputs, then divide. Round to the nearest hundredth when needed.

Download the practice pages alone, or include a separate answer key or teacher model. Longer activities may use more than one page.

Customize this worksheet

Paper sizes and printing help · More general functions activities

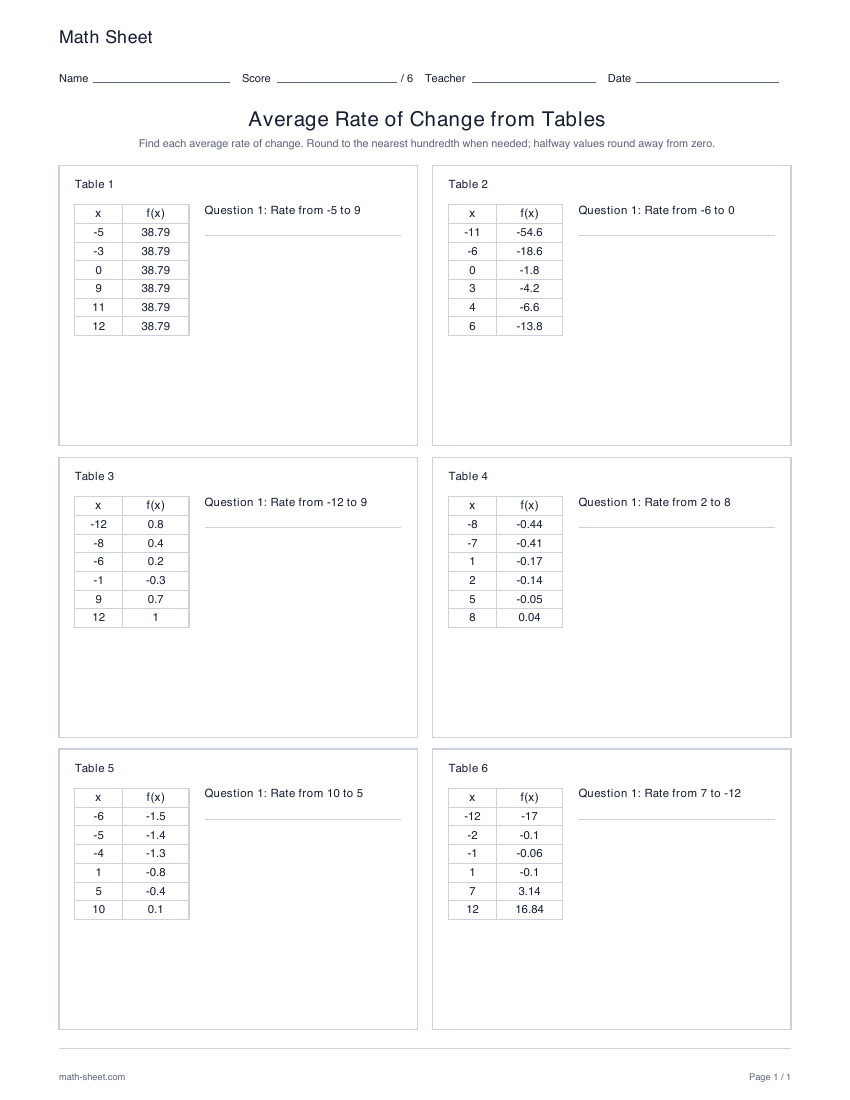
Six tables. One or two intervals each.

Every worksheet contains six tables with six input-output pairs each. Choose six questions for one interval per table, or twelve questions for two intervals per table. Each calculation earns one mark.

Read the values directly from the table. The average rate is the change in f(x) divided by the change in x; it does not require guessing a formula for the function.

The answer key repeats each table and shows the substituted calculation, the exact result, and an approximate decimal when needed. Round halfway values away from zero: 0.125 becomes 0.13 and −0.125 becomes −0.13.

Learning objective

What this activity builds

Read two input-output pairs from a table and divide the change in output by the matching change in input.

Worked example

If f(−2) = 1.5 and f(4) = 6, what is the average rate?

(6 − 1.5) ÷ (4 − (−2)) = 4.5 ÷ 6 = 0.75.

The output increases by 4.5 as the input increases by 6. Dividing these changes gives 0.75 per input unit. Reversing both subtraction orders produces the same quotient.

Teaching notes

Make the practice count

  • Mark both requested rows before doing any arithmetic.
  • Keep the subtraction order the same in the numerator and denominator.
  • Use the two specified inputs, even when other rows appear between them.
  • Compare two intervals from the same table in the 12-question setting.
  • Keep exact values until the final step; round a halfway value away from zero.

Make it yours

Customize the practice

Choose your options, update the preview, then download the exact same pages.

Choose the practice settings, update the preview and print the same questions with a separate answer key.

Worksheet settings

Page note and reproducible seed

The same settings and seed make the same questions. Shared links include your page note; leave personal information out. Notes use the selected language’s supported characters; English accepts basic Latin text.

Configured PDF · Average Rate of Change from Tables · US Letter

Preview ready. Download includes these exact pages.

1 student page
Enlarged pages scroll. PDF size stays the same.
Math SheetNameScore/ 6TeacherDateAverage Rate of Change from TablesFind each average rate of change. Round to the nearest hundredth when needed; halfway values round away from zero.Table 1xf(x)-538.79-338.79038.79938.791138.791238.79Question 1: Rate from -5 to 9Table 2xf(x)-11-54.6-6-18.60-1.83-4.24-6.66-13.8Question 1: Rate from -6 to 0Table 3xf(x)-120.8-80.4-60.2-1-0.390.7121Question 1: Rate from -12 to 9Table 4xf(x)-8-0.44-7-0.411-0.172-0.145-0.0580.04Question 1: Rate from 2 to 8Table 5xf(x)-6-1.5-5-1.4-4-1.31-0.85-0.4100.1Question 1: Rate from 10 to 5Table 6xf(x)-12-17-2-0.1-1-0.061-0.173.141216.84Question 1: Rate from 7 to -12math-sheet.comPage 1 / 1

A useful next step

Related activities

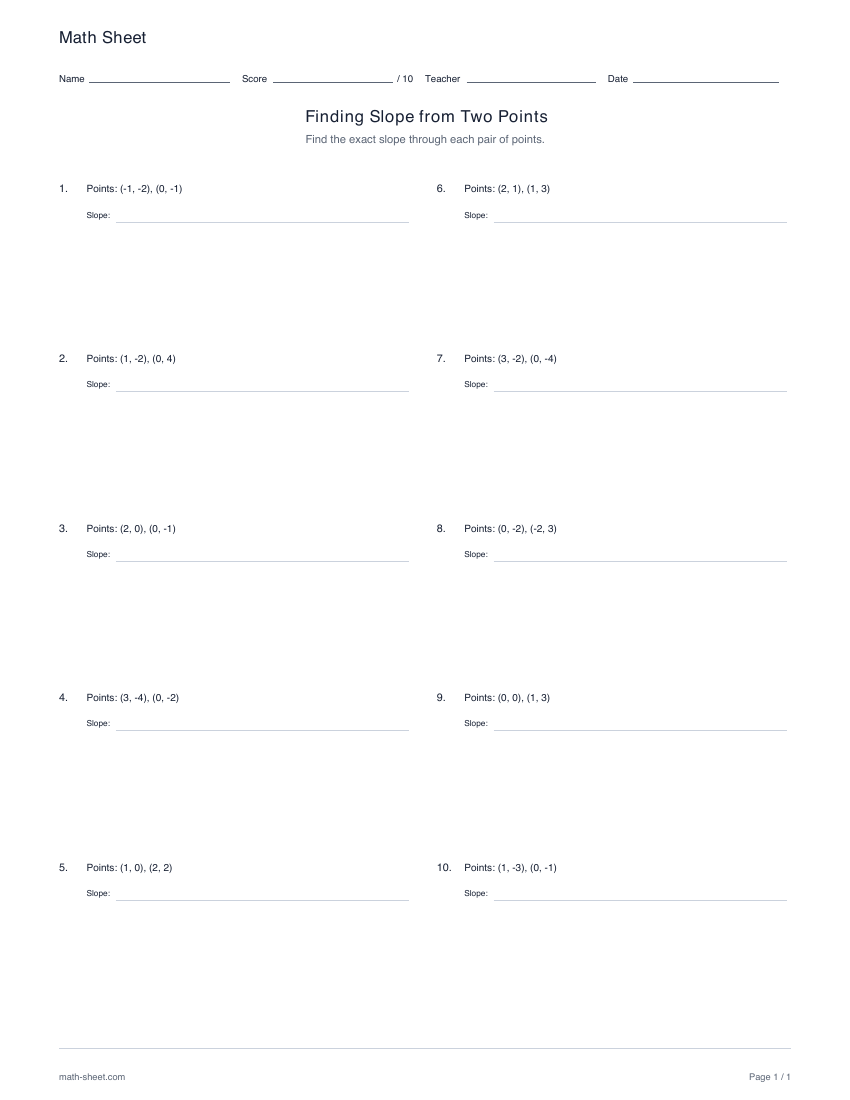
First page preview: Finding slope from two points worksheets

Linear functions

Finding slope from two points worksheets

Calculate exact slopes from ten pairs of integer-coordinate points. Practice signed differences and reduced fractions, with a separate key that explains the slope calculation.

Preview and download
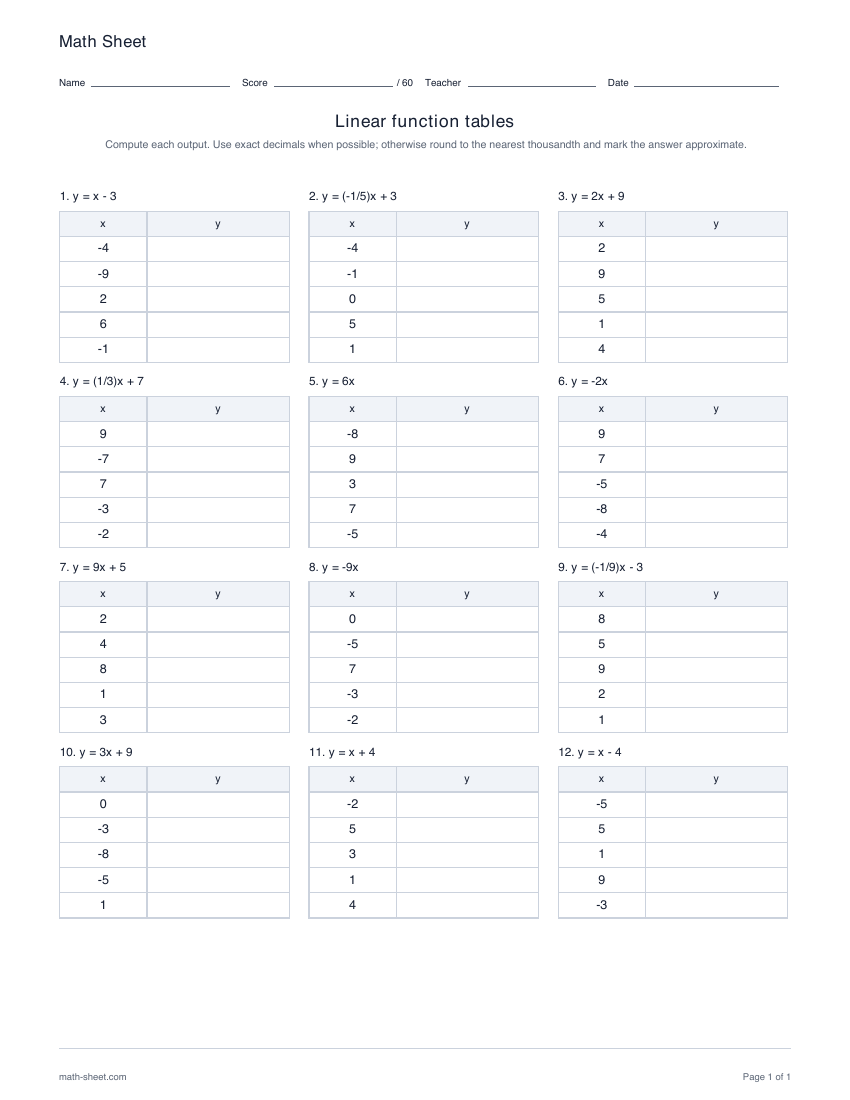
Printable linear function tables worksheet preview

Function table

Linear function tables

Substitute five inputs into each of twelve linear rules. Choose whole or fractional slopes, signed or nonnegative inputs, and decimal or exact fraction answers.

Preview and download
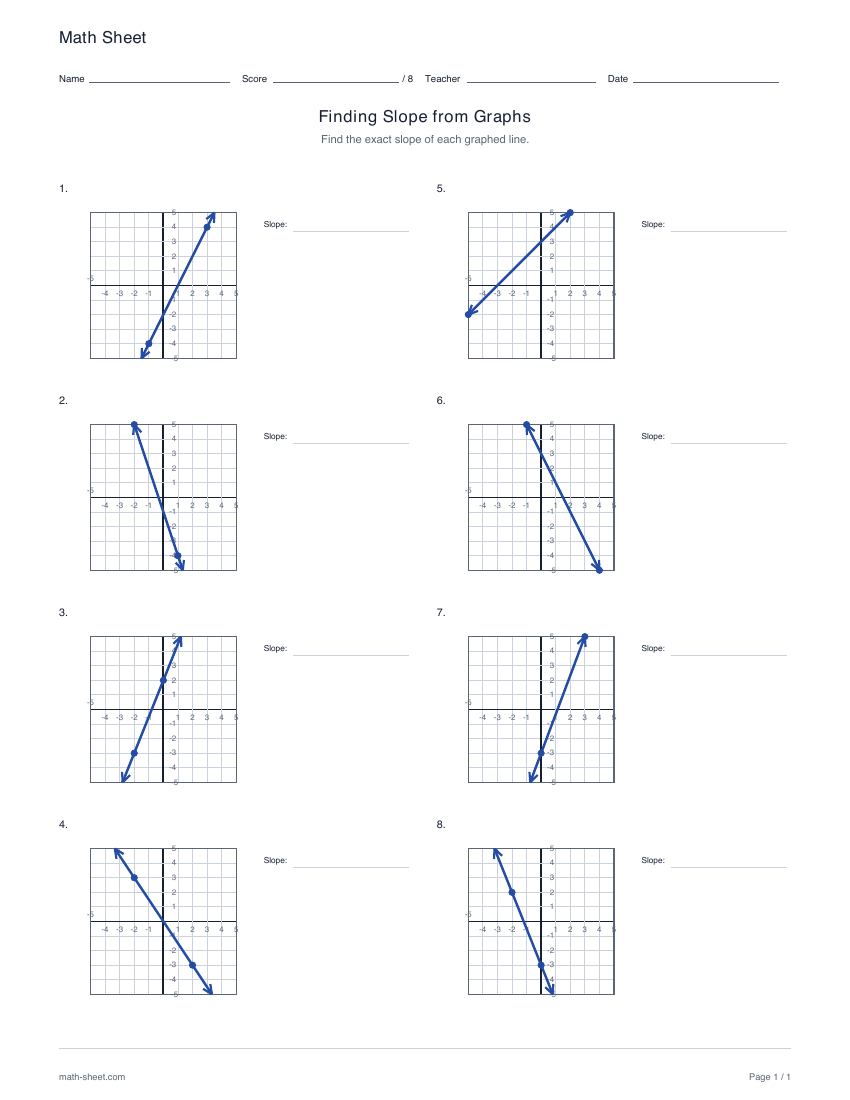
First page preview: Finding slope from graphs worksheets

Linear functions

Finding slope from graphs worksheets

Read eight graphed lines and find each exact slope. Use the coordinate scale to compare rise and run, then check a separate answer key with worked calculations.

Preview and download