General functions practice

Graphing logarithmic functions worksheets

Find exact domains and all-real ranges, then graph eight logarithmic functions with vertical asymptotes on fixed square grids. Includes affine arguments, fractional boundaries and separate answer keys.

Ready-made English PDF · fixed settings

Customization below makes a separate PDF.

Fixed English ready-made files. Custom settings below apply only to the configured PDF.

Ready to print

Start with a ready-made worksheet

Set the logarithm argument greater than zero to find the domain and vertical asymptote. Plot exact points where the argument is 1 and 1/base, then draw a smooth increasing curve on the domain side of the asymptote.

Download the practice pages alone, or include a separate answer key or teacher model. Longer activities may use more than one page.

Customize this worksheet

Paper sizes and printing help · More general functions activities

Find the boundary. Stay on the domain side.

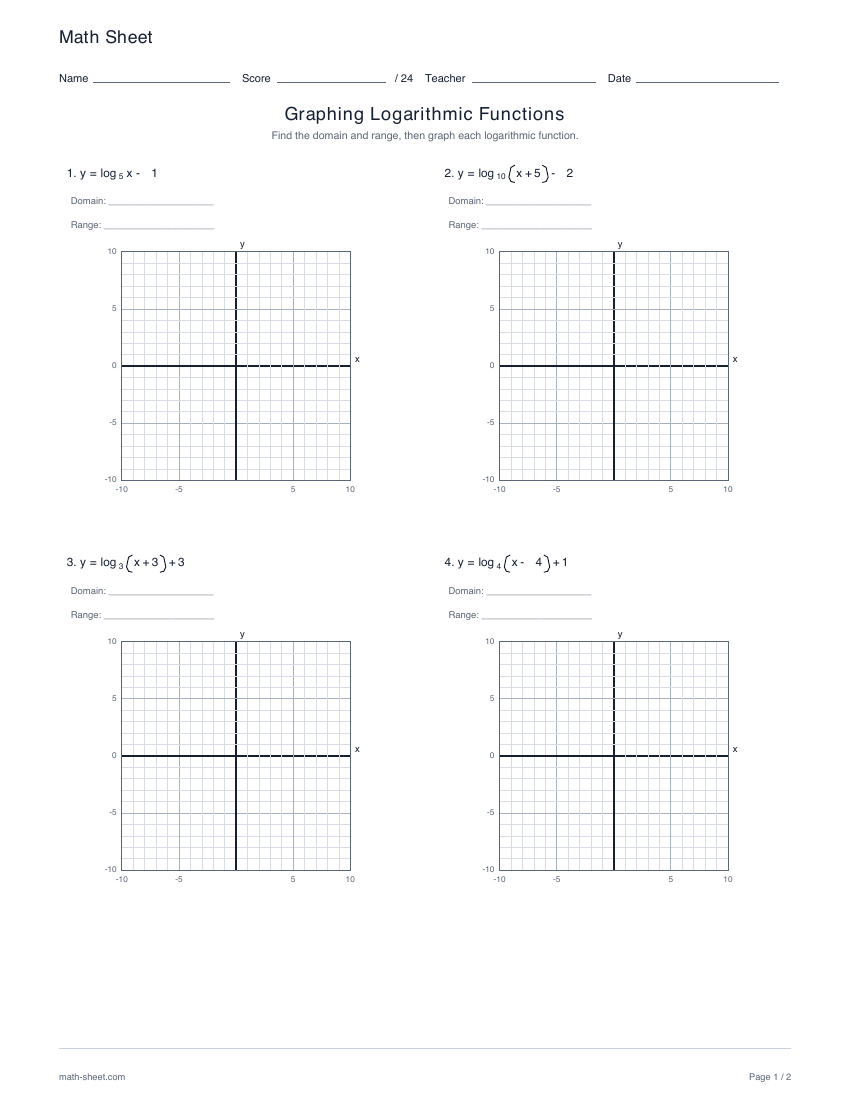
Each worksheet has eight logarithmic functions. For every task, find the exact domain and range, then graph the curve on a square grid from −10 to 10.

For y = log_b(mx + c) + k, solve mx + c > 0. The exact boundary x = −c/m is a vertical asymptote and is not part of the domain. The range is all real numbers.

Plot a point where the argument is 1, which gives y = k. A second exact point where the argument is 1/b lies one unit lower. Draw a smooth increasing curve that approaches the asymptote without touching it.

Learning objective

What this activity builds

Connect a logarithmic equation to its strict domain, vertical asymptote and increasing curve.

Worked example

Find the domain and range, then graph y = log₃(2x − 4) + 1.

Domain x > 2; range all real numbers; vertical asymptote x = 2.

The argument requires 2x − 4 > 0. At x = 5/2 the argument is 1, so y = 1. At x = 13/6 the argument is 1/3, so y = 0.

Teaching notes

Make the practice count

  • Solve mx + c > 0 exactly before graphing.
  • Draw x = −c/m as a vertical asymptote.
  • Use the argument value 1 to plot a point at height k.
  • Use the argument value 1/base to plot a second point one unit lower.
  • Keep every curve on the side where mx + c is positive.
  • Remember that a logarithmic function has all real outputs.

Make it yours

Customize the practice

Choose your options, update the preview, then download the exact same pages.

Choose the practice settings, update the preview and print the same questions with a separate answer key.

Worksheet settings

Page note and reproducible seed

The same settings and seed make the same questions. Shared links include your page note; leave personal information out. Notes use the selected language’s supported characters; English accepts basic Latin text.

Configured PDF · Graphing Logarithmic Functions · US Letter

Preview ready. Download includes these exact pages.

2 student pages
Enlarged pages scroll. PDF size stays the same.
Math SheetNameScore/ 24TeacherDateGraphing Logarithmic FunctionsFind the domain and range, then graph each logarithmic function.1. y =log5x-1Domain: ____________________Range: _____________________-10-5510-10-50510xy2. y =log10x+5-2Domain: ____________________Range: _____________________-10-5510-10-50510xy3. y =log3x+3+3Domain: ____________________Range: _____________________-10-5510-10-50510xy4. y =log4x-4+1Domain: ____________________Range: _____________________-10-5510-10-50510xymath-sheet.comPage 1 / 2
Math SheetNameScore/ 24TeacherDateGraphing Logarithmic FunctionsFind the domain and range, then graph each logarithmic function.5. y =log83·x-1+3Domain: ____________________Range: _____________________-10-5510-10-50510xy6. y =log74·x+5-2Domain: ____________________Range: _____________________-10-5510-10-50510xy7. y =log84·x-5+5Domain: ____________________Range: _____________________-10-5510-10-50510xy8. y =log62·x-1+2Domain: ____________________Range: _____________________-10-5510-10-50510xymath-sheet.comPage 2 / 2

A useful next step

Related activities

First page preview: Graphing exponential functions worksheets

General functions

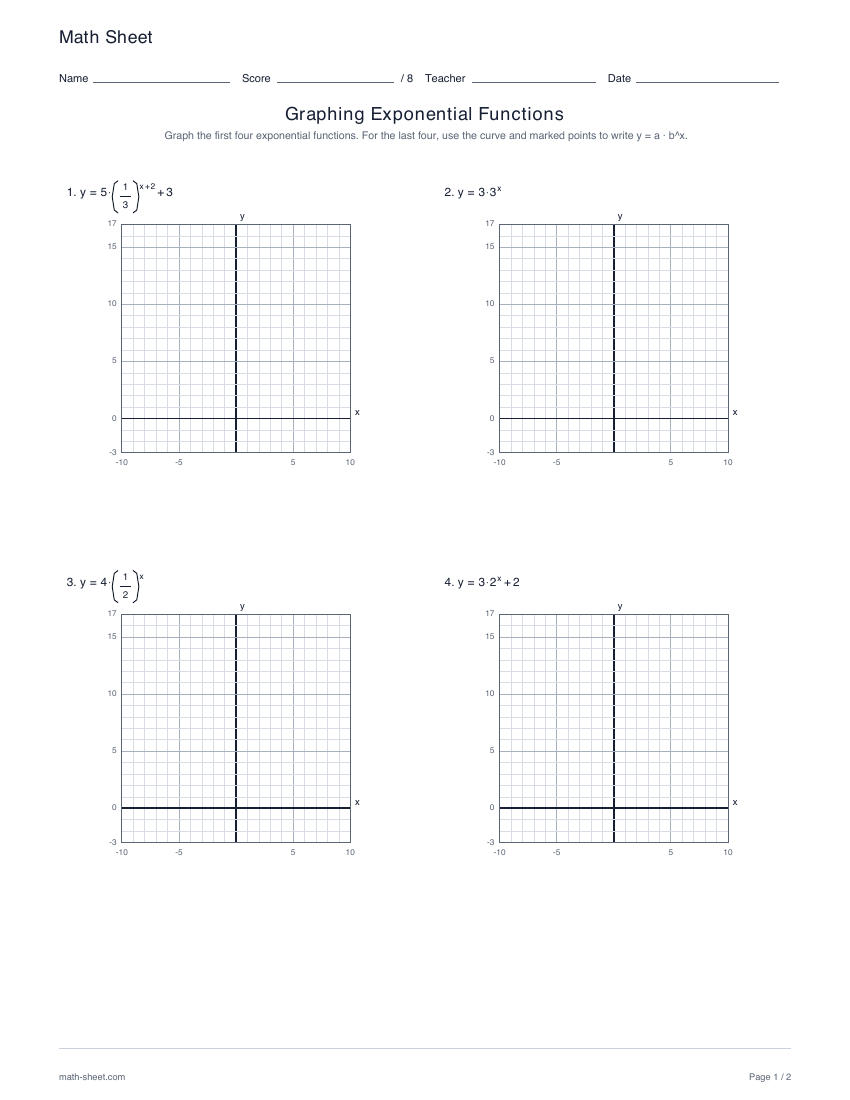
Graphing exponential functions worksheets

Graph eight exponential functions or write equations from curves with exact marked points. Compare growth, decay and translations on fixed unit grids with separate answer keys.

Preview and download
First page preview: Meaning of logarithms worksheets

Exponents and radicals

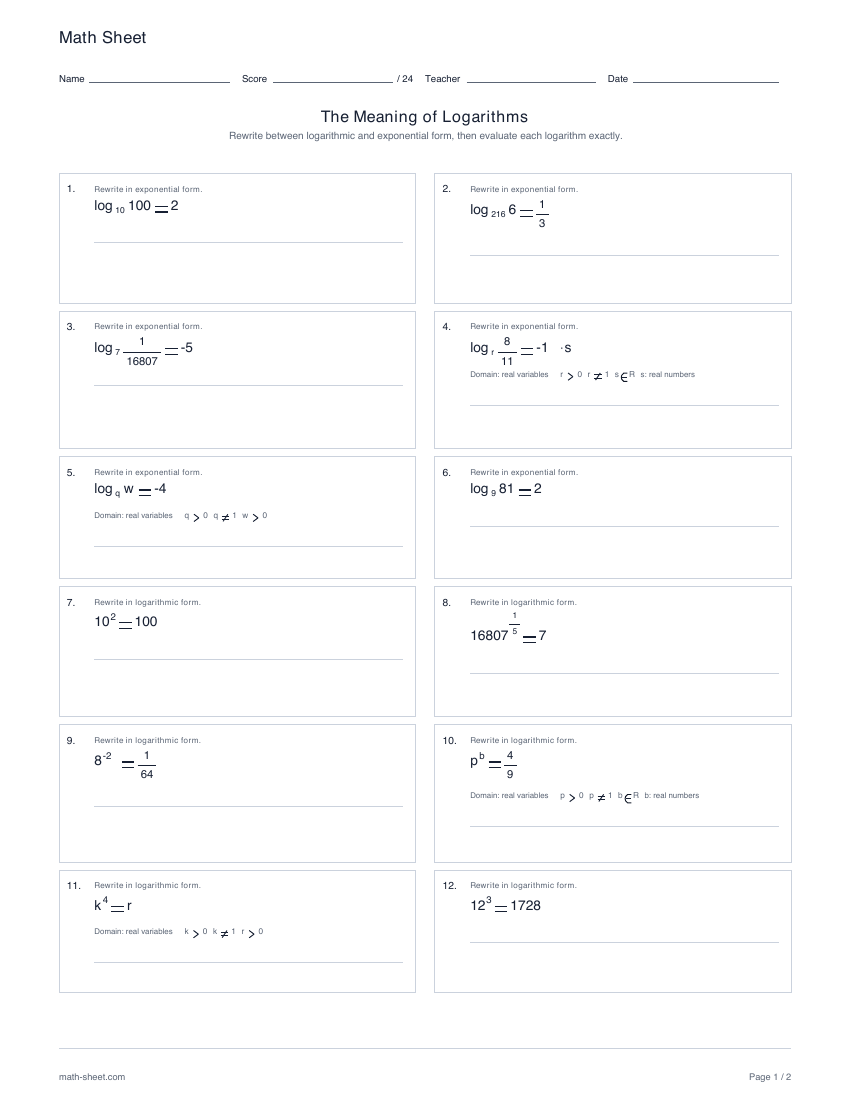
Meaning of logarithms worksheets

Rewrite exponential and logarithmic equations and evaluate exact logarithms. Choose numeric or symbolic forms, fractional exponents and reciprocal arguments, with separate answers.

Preview and download
First page preview: Domain and range from graphs worksheets

General functions

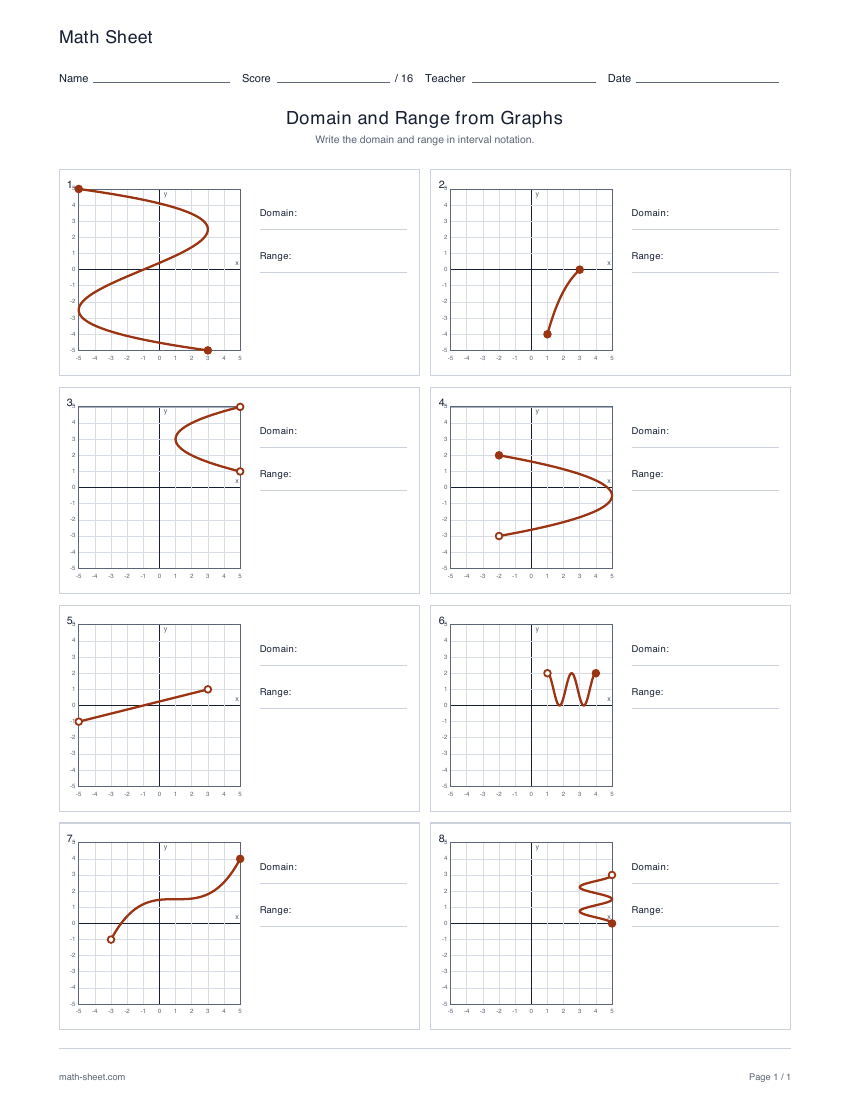
Domain and range from graphs worksheets

Read finite domain and range intervals from eight varied relation graphs. Practice open and closed extrema and optionally apply the vertical line test.

Preview and download