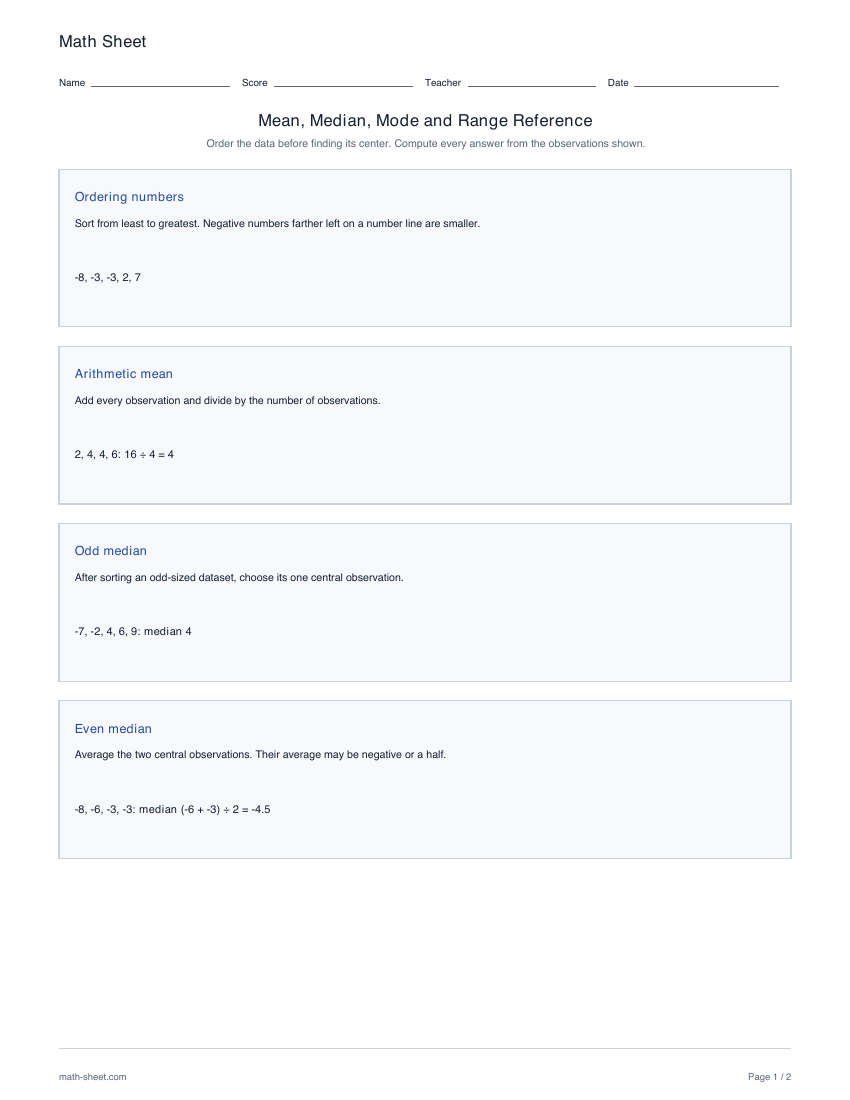
Print a reference that explains mean, median, mode and range with worked examples. Compare odd and even datasets, negative values, tied modes and data with no mode.
Fixed English ready-made files. Custom settings below apply only to the configured PDF.
Ready to print
Print the reference handout
Read each definition alongside its worked example. Put the observations in numerical order before finding the median, and count every repeated value before deciding the mode.
Download the complete reference with its explanations and worked examples. This handout does not need a separate answer key.
The English reference uses two pages to explain the four measures with worked examples. It includes even and odd dataset lengths, negative values, several modes and no mode. The examples and explanations are part of the handout; there is no separate answer key.
Print in US Letter or A4. Use the reference during a short practice set, then ask learners to explain the difference between the measures in their own words.
Learning objective
What this activity builds
Explain what each statistic describes and choose the correct calculation for a raw dataset.
Worked example
Find the mean, median, mode and range of 7, 3, 5, 5.
Mean = 5. Median = 5. Mode = 5. Range = 4.
The sum is 20, so the mean is 20 ÷ 4 = 5. In order, the values are 3, 5, 5, 7; the two middle values average to 5. The value 5 appears most often. The range is 7 − 3 = 4.
Teaching notes
Make the practice count
Describe mean as a fair-share value, median as a middle value and mode as the most frequent value.
Use one dataset to compare the four calculations before moving to several different sets.
Include an even-sized example so students practice averaging the two middle values.
Discuss a dataset with no repeated values and one with several equally frequent repeated values.
Make it yours
Customize the reference
Choose your options, update the preview, then download the exact same pages.
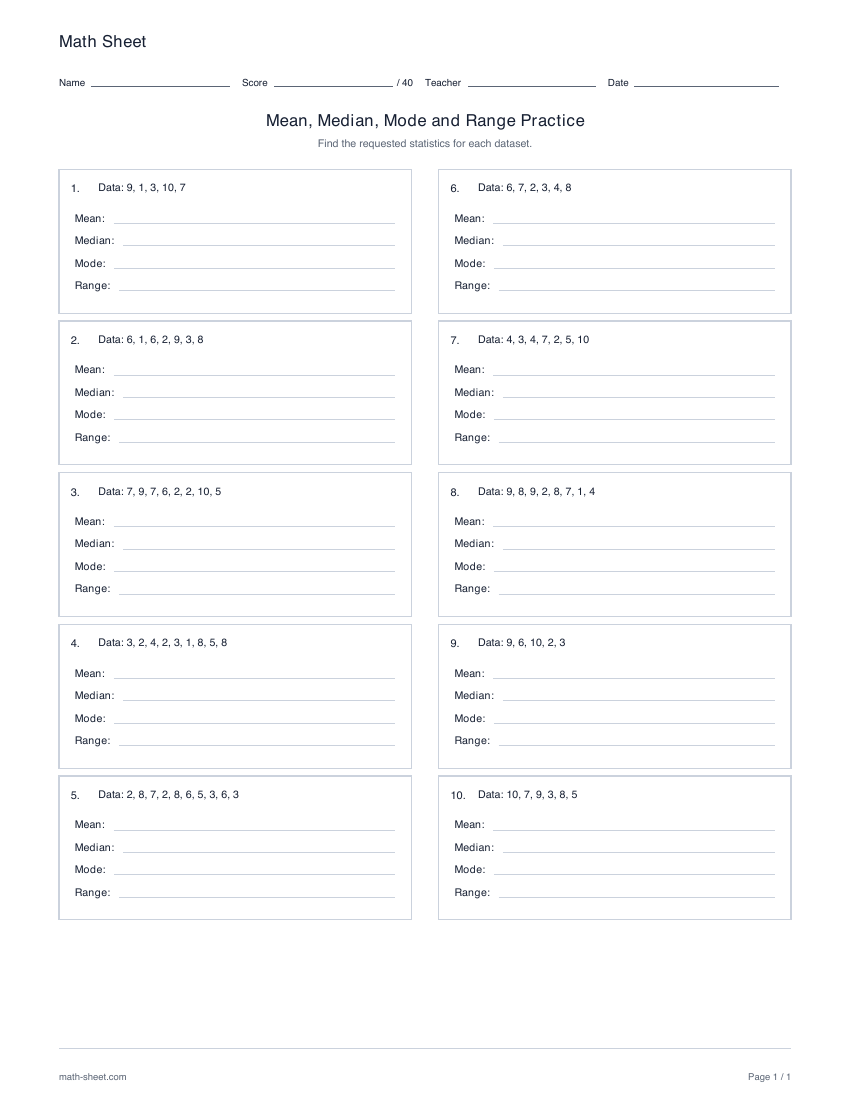
Generate ten datasets for mean, median, mode and range practice. Choose the requested statistics, observations per dataset, number range and signs, with separate answer pages.