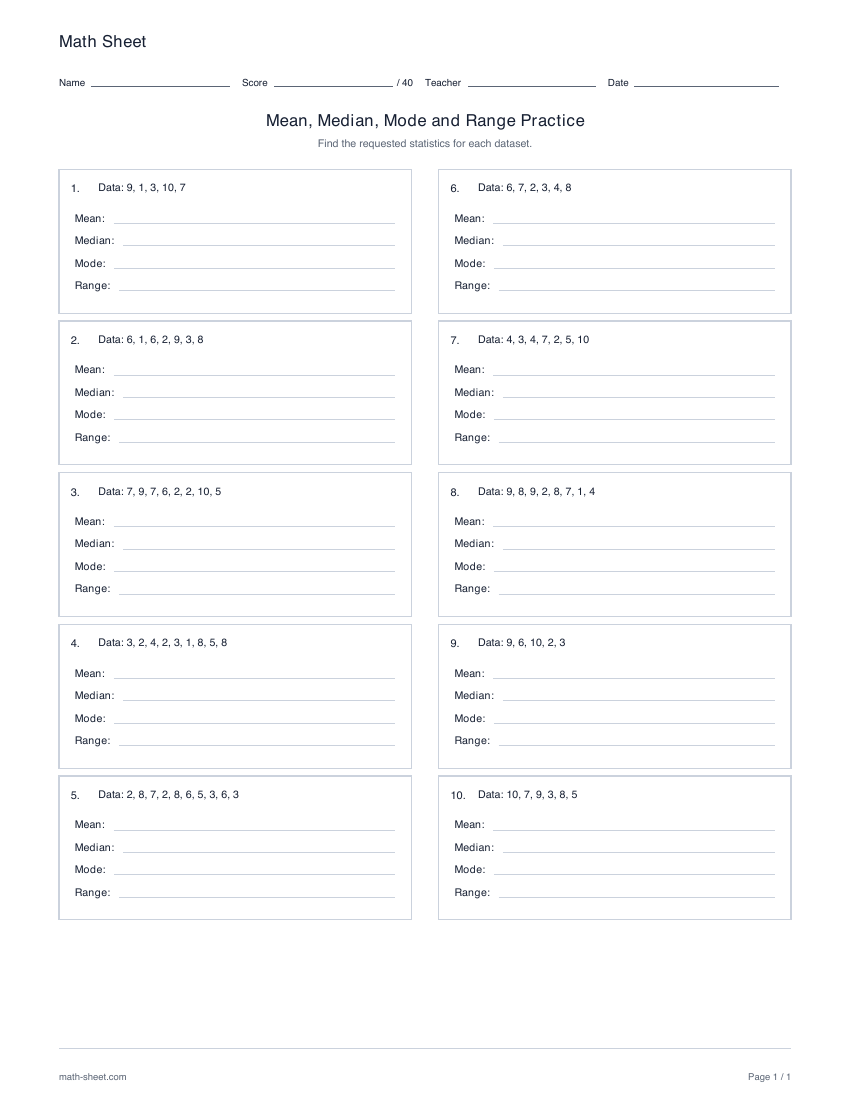
Generate ten datasets for mean, median, mode and range practice. Choose the requested statistics, observations per dataset, number range and signs, with separate answer pages.
Fixed English ready-made files. Custom settings below apply only to the configured PDF.
Ready to print
Start with a ready-made worksheet
For each dataset, find only the statistics requested. Show your work. Sort the observations before finding the median and check all frequencies before writing the mode.
Download the practice pages alone, or include a separate answer key or teacher model. Longer activities may use more than one page.
Choose a fixed set of statistics, or ask for a random pair on each question. Select a dataset-length range, the magnitude of the observations and positive, negative or mixed signs. Each worksheet has ten datasets.
Generated practice uses integer observations and whole-number means. Even-sized datasets can have a median ending in .5. Repeated observations count separately when finding a mean, and all values tied for the highest repeated frequency belong in the mode answer.
Learning objective
What this activity builds
Calculate selected statistics accurately from the observations shown, including repeated values and signed numbers.
Worked example
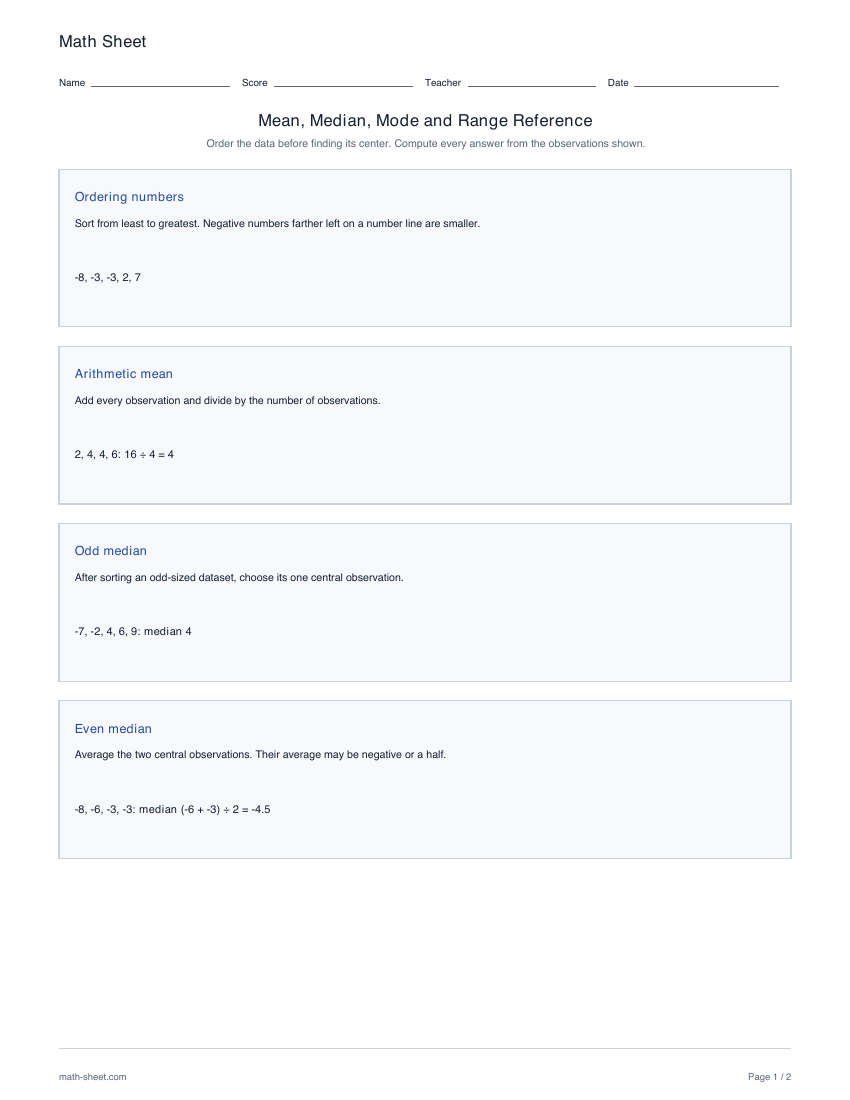
For −8, −6, −3, −3, find the mean and median.
Mean = −5. Median = −4.5.
The sum is −20, so the mean is −20 ÷ 4 = −5. The two central observations are −6 and −3, whose average is −9 ÷ 2 = −4.5. A whole-number mean does not require a whole-number median.
Teaching notes
Make the practice count
Begin with mode and range when the learning goal is reading and comparing a dataset.
Separate the number of observations in a dataset from the number of questions on the worksheet.
Ask learners to list every repeated value tied for the highest frequency, and use “no mode” when all values occur once.
Try random two after each measure is understood; it asks for two different statistics on each question.
Make it yours
Customize the practice
Choose your options, update the preview, then download the exact same pages.
Random two chooses two different statistics from all four for each dataset. It overrides your checked statistics while keeping those selections for when you switch it off. Every practice sheet has ten datasets; the dataset-size setting controls the number of observations in each one.
Print a reference that explains mean, median, mode and range with worked examples. Compare odd and even datasets, negative values, tied modes and data with no mode.