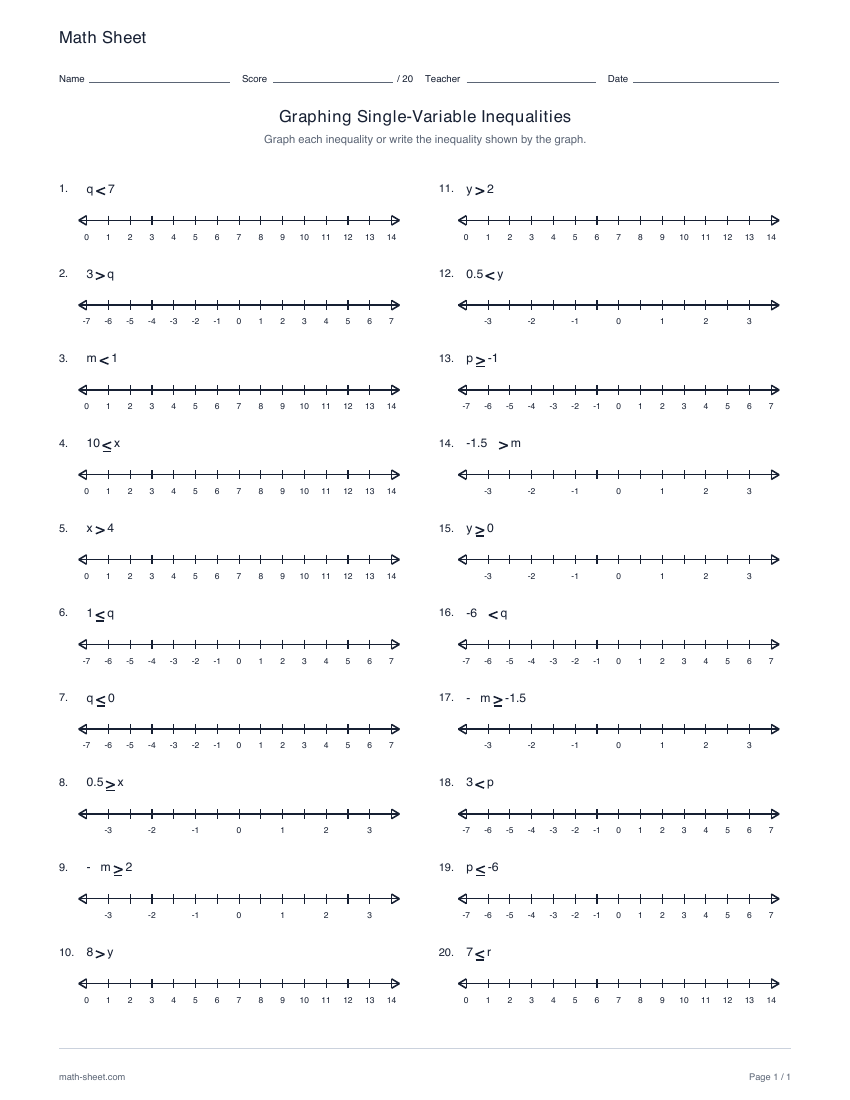
Translate between an inequality and a number-line graph in twenty questions. Choose whole numbers, signed integers or halves; draw graphs, read graphs or mix both tasks, with a separate key.
Fixed English ready-made files. Custom settings below apply only to the configured PDF.
Ready to print
Start with a ready-made worksheet
For a given inequality, draw its solution on the number line. For a given graph, write an equivalent inequality. Decide whether the boundary belongs to the solution before drawing the endpoint.
Download the practice pages alone, or include a separate answer key or teacher model. Longer activities may use more than one page.
Choose twenty given inequalities to graph, twenty graphs to read, or a balanced mixed set with ten of each. Whole-number practice uses a nonnegative unit scale; integer practice includes signed values; halves use half-unit ticks and decimal notation.
The comparison checkboxes select symbols in the original question. A negative variable, a negative coefficient or the variable appearing on the right can mean that the solved inequality uses the opposite direction. Always normalize the relationship before choosing the ray.
Learning objective
What this activity builds
Represent a solution set using the correct boundary, endpoint inclusion and ray direction.
Worked example
Graph −x ≤ 2.5.
x ≥ −2.5: a filled endpoint at −2.5 and a ray to the right.
Divide both sides by −1 and reverse the comparison. The value −2.5 is included because equality is allowed. Values to its right, such as 0, make the original inequality true.
Teaching notes
Make the practice count
Begin with nonnegative whole-number boundaries.
Read each labeled interval before locating a half-unit value.
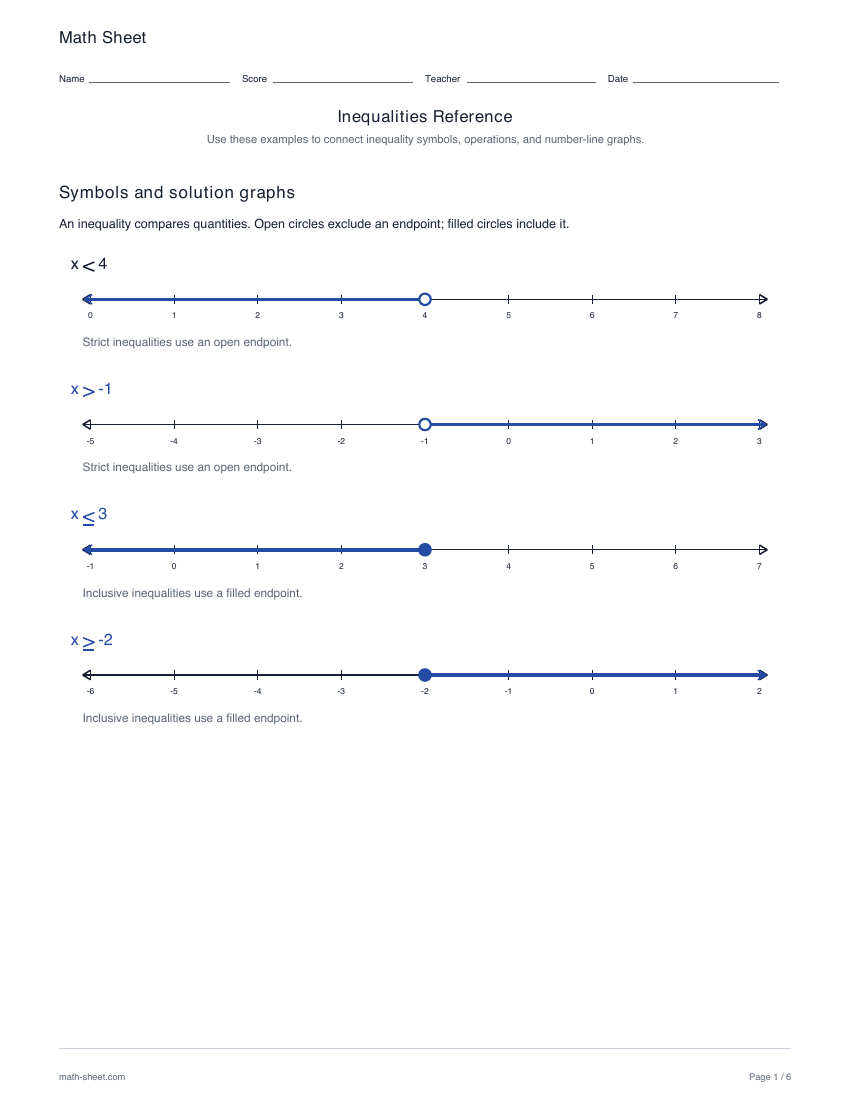
Compare x < 4 with 4 > x; they describe the same set.
Use a point on each side of the boundary to check the ray.
Make it yours
Customize the practice
Choose your options, update the preview, then download the exact same pages.
Relationships select the literal operator printed in each prompt. Solving a negated variable can reverse the normalized answer. Mixed mode interleaves exactly ten graph and ten write tasks.
Print a complete guide to inequality symbols, number-line graphs and equivalent transformations. Explore addition, subtraction, signed multiplication and division, and transitive comparisons with examples.
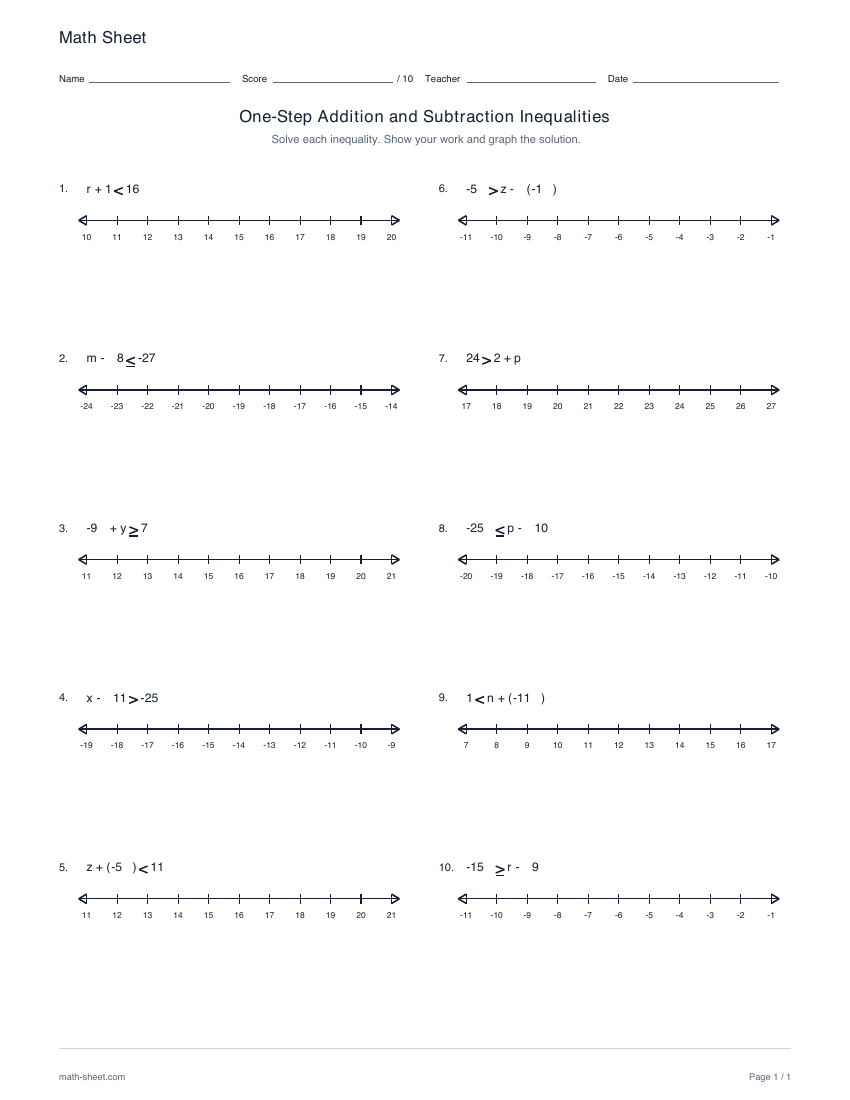
Solve and graph ten one-step inequalities using addition or subtraction. Practice expressions on either side, choose comparison symbols and print a worked solution key.
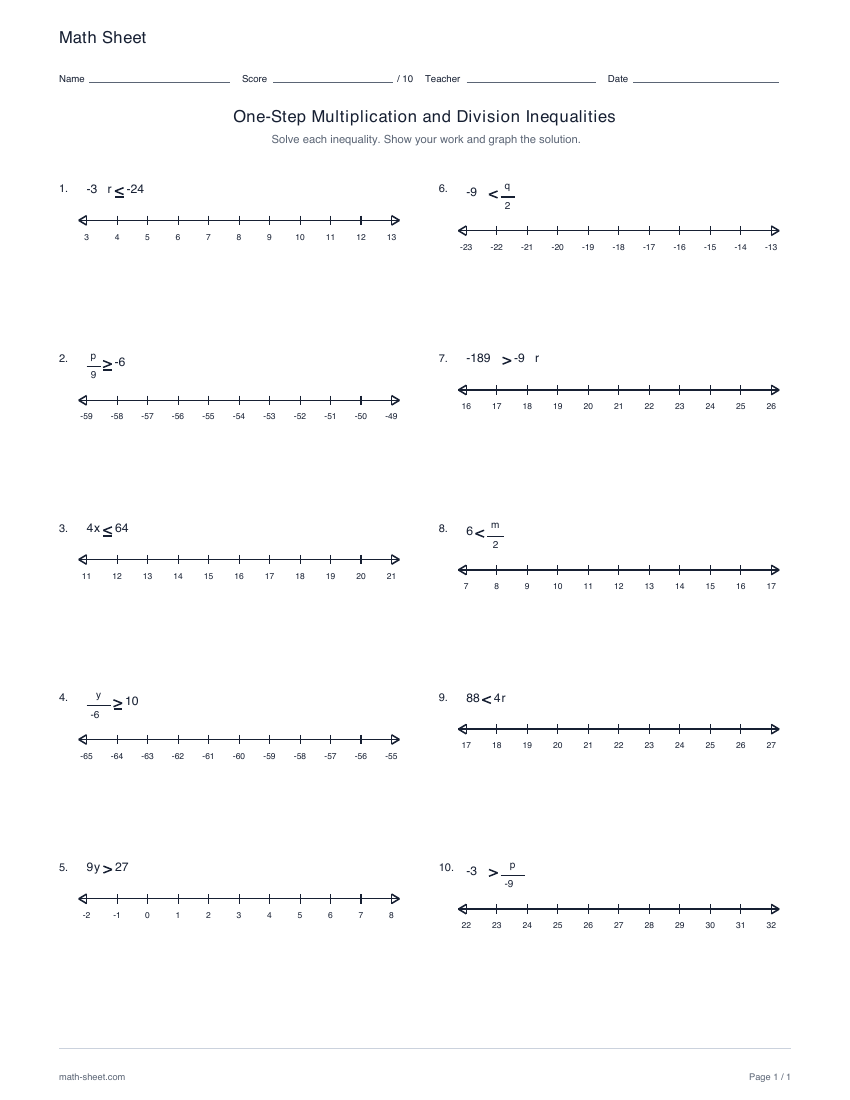
Solve and graph ten one-step inequalities with signed coefficients and divisors. Learn when to reverse the comparison, using exact integer boundaries and explained answer keys.