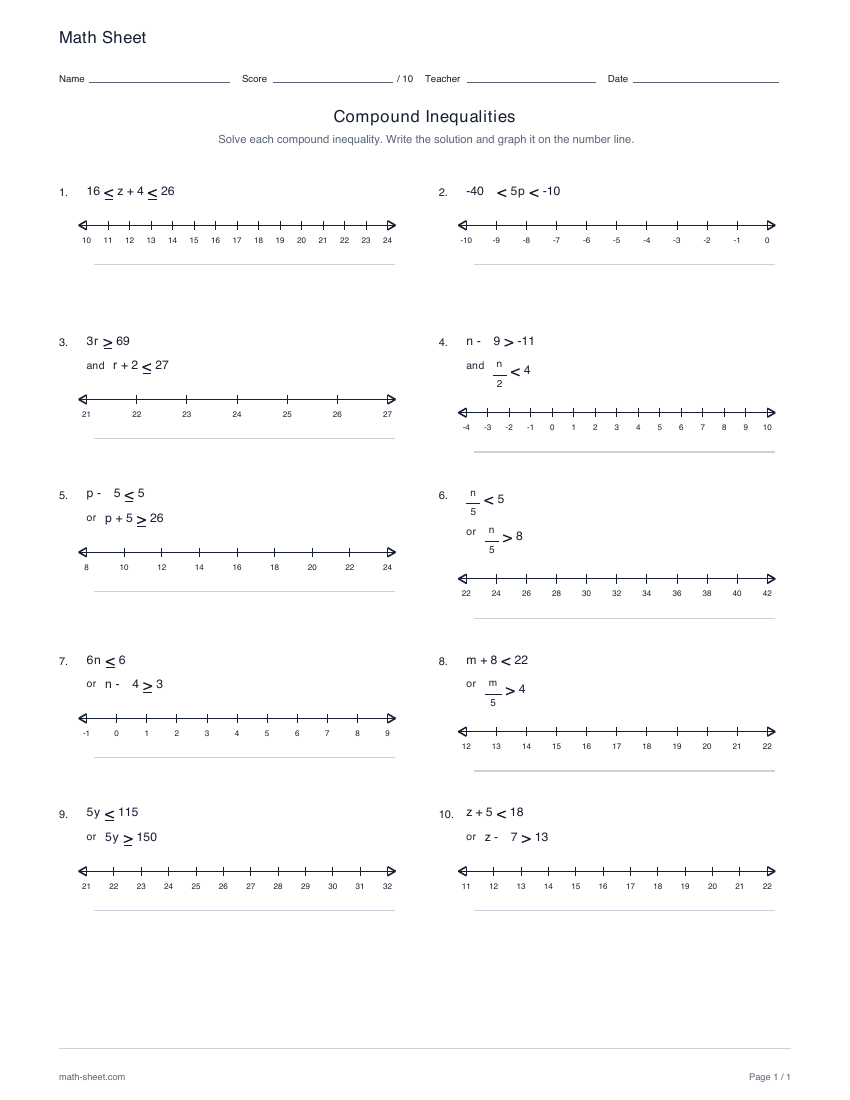
Solve and graph ten compound inequalities. Choose addition and subtraction, multiplication and division, or mixed operations, then connect AND intervals and OR rays with a separate graphical answer key.
First solve each inequality. AND keeps their overlap; OR includes everything in either solution. A chain such as −4 ≤ x + 2 ≤ 8 is an AND statement: subtract 2 from all parts to obtain −6 ≤ x ≤ 6.
For x < −1 or x > 3, the region between −1 and 3 satisfies neither condition. Draw an open circle at each boundary and shade outward in both directions. Arrows show that the rays continue beyond the printed window.
These ten-task worksheets use integer boundaries, positive multipliers or divisors, four bounded AND intervals and six OR pairs of rays. Each student task includes a blank number line and a symbolic response line. Separate keys provide both the simplified solution and its graph.
Questions about compound inequalities
How are AND and OR different?
AND takes the intersection: a value must satisfy both conditions. OR takes the union: satisfying either condition is enough. The AND questions give bounded intervals, and the OR questions give two disjoint outward rays.
How do I solve a three-part comparison?
A chain such as −8 < 2x < 6 means −8 < 2x AND 2x < 6. Divide all three parts by 2 to obtain −4 < x < 3, then graph the open interval between the boundaries.
What does each operation mode include?
Addition/subtraction uses additive expressions. Multiplication/division uses positive multiples and fractions with positive divisors. Mixed mode includes both and combines different operations within some tasks. Each sheet has ten tasks: four AND questions and six OR questions.
Which boundaries and endpoint styles do the worksheets use?
Worksheets use integer boundaries and matching endpoint styles within each task. Strict comparisons use two open circles; inclusive comparisons use two filled circles.
Are only whole-number answers allowed on the graph?
No. The graph describes all real values in the solution set, including values between labeled ticks. The task uses the same number-line scale in its student and answer editions.
Learning objective
What this activity builds
Combine the solution sets of two inequalities using intersection for AND and union for OR.
Worked example
Solve and graph 2x > −6 and x + 4 < 9.
Divide the first comparison by 2 to get x > −3. Subtract 4 in the second to get x < 5. Together: −3 < x < 5.
AND requires both conditions, so keep their overlap. Draw a segment from −3 to 5 with an open circle at each endpoint. For example, x = 0 satisfies both comparisons; x = 6 satisfies only the first and is excluded.
Teaching notes
Make the practice count
Solve the two comparisons separately before combining their sets.
Read a chained comparison as two conditions connected by AND.
For AND, keep values that satisfy both conditions; for OR, keep values that satisfy either one.
Test both finite boundaries and a value in each region of the number line.
Read the labeled scale before placing an endpoint between ticks.
Treat an integer boundary as a real-number cutoff, not a restriction to integer solutions.
Make it yours
Customize the practice
Choose your options, update the preview, then download the exact same pages.
Choose addition/subtraction, multiplication/division or mixed operations. Each set has four AND tasks and six OR tasks, integer boundaries and matching endpoint inclusion within each task. Positive multipliers and divisors keep the operation choices focused; mixed tasks can combine different operations in one prompt.
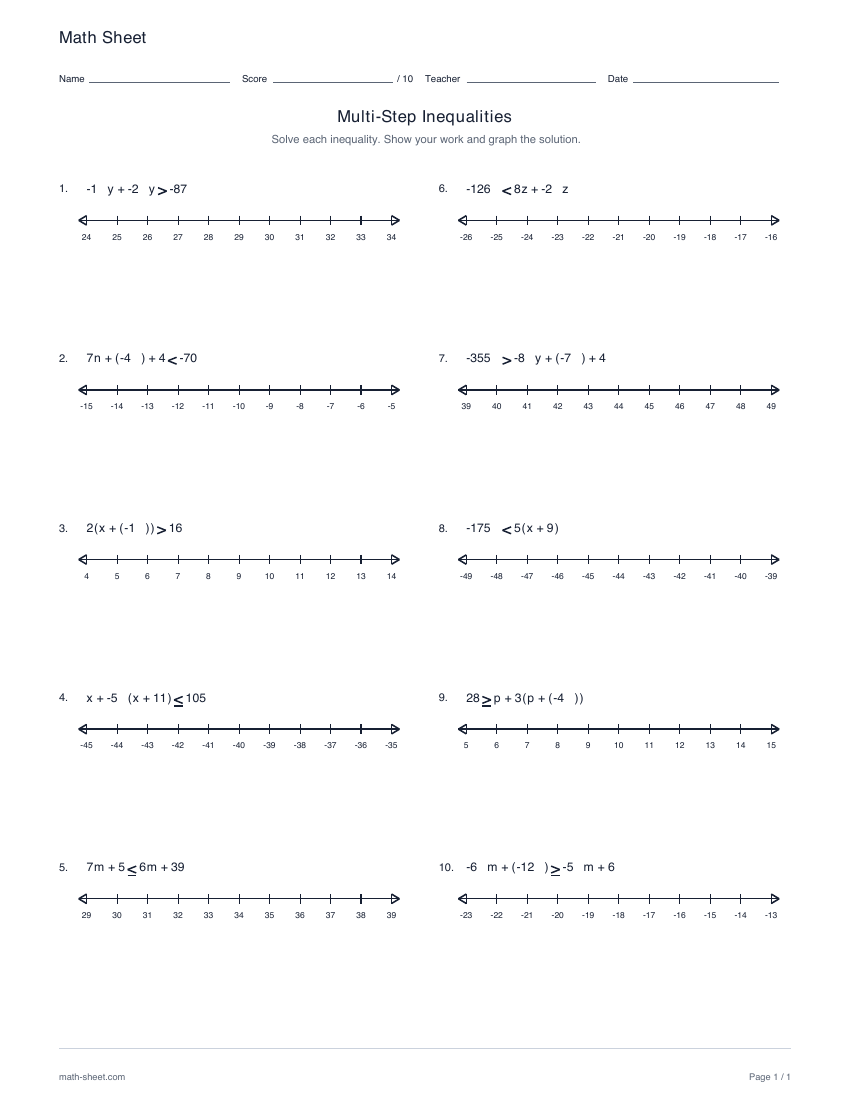
Distribute factors, combine like terms and solve ten linear inequalities with variables on either or both sides. Print exact solutions, explained sign reversals and number-line graphs.
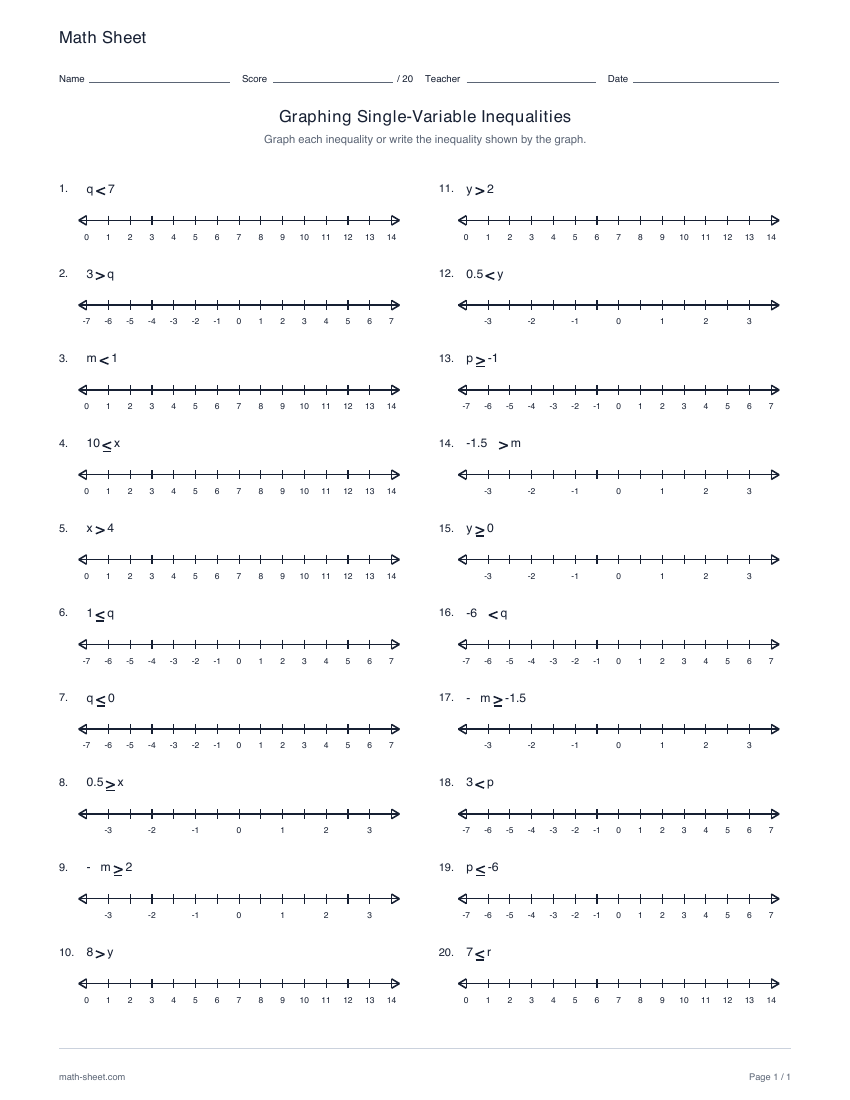
Translate between an inequality and a number-line graph in twenty questions. Choose whole numbers, signed integers or halves; draw graphs, read graphs or mix both tasks, with a separate key.
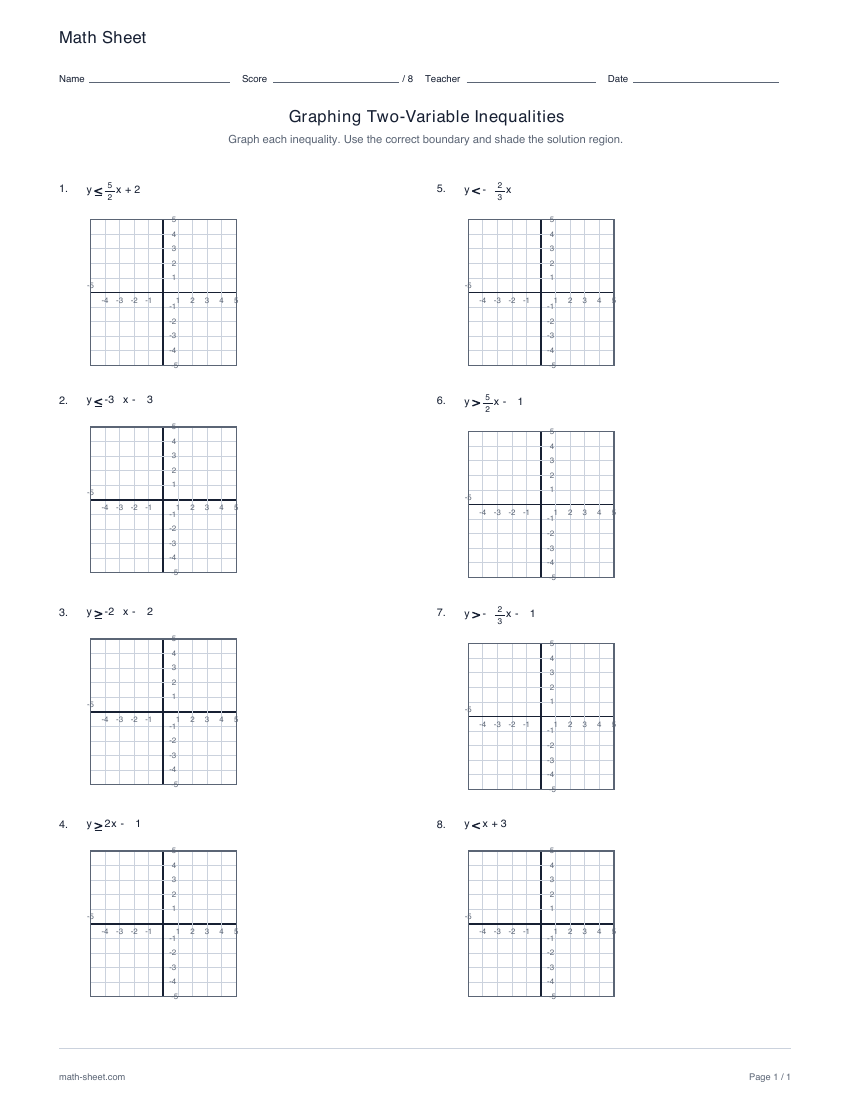
Graph eight linear inequalities on coordinate planes. Select any nonempty combination of <, ≤, > and ≥, then draw the boundaries and shade the solution regions with a separate graphical key.