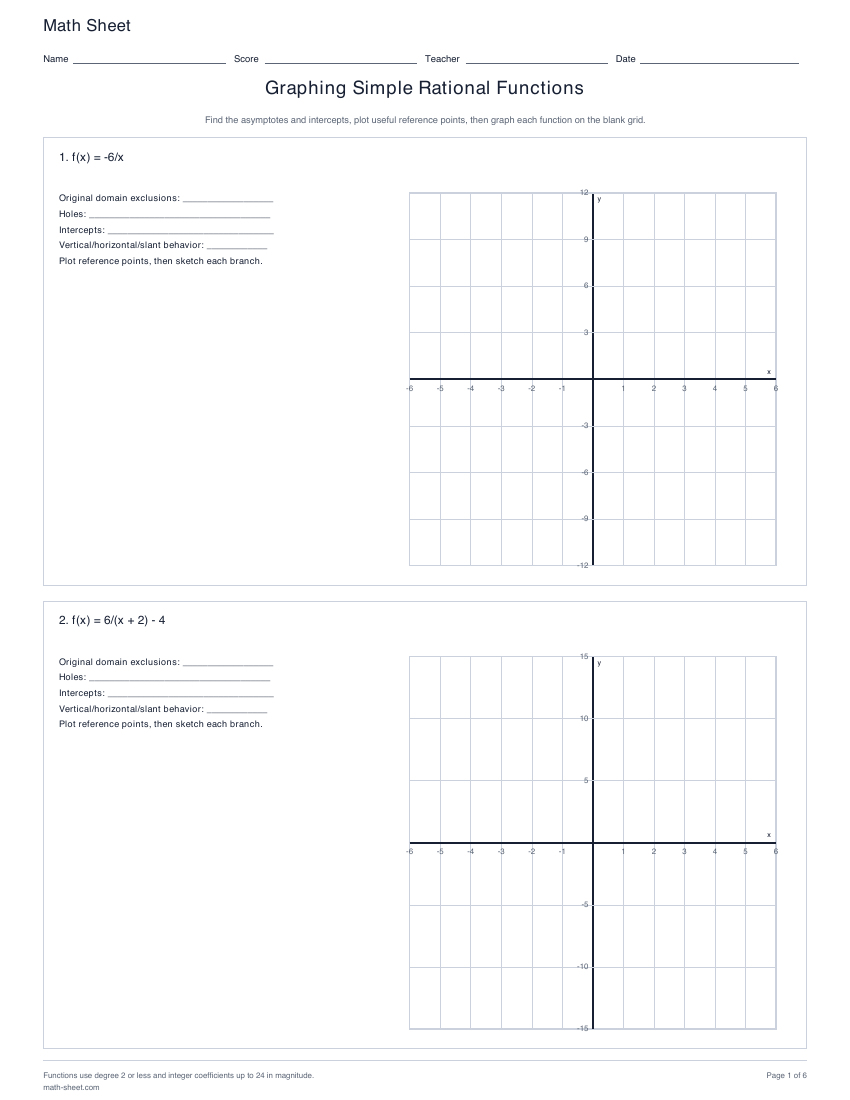
Graph reciprocal functions and their horizontal or vertical shifts on labeled grids, with exact asymptotes, intercepts and reference points in a separate answer key.
Each worksheet can mix a/x, a/(x-h) and a/(x-h)+k. Draw the vertical and horizontal asymptotes first, then plot exact reference points on both sides of the break.
Scales are nonzero integers from -6 to 6. Nonzero horizontal and vertical shifts range from -4 to 4 so the selected transformed families remain visibly distinct.
Questions teachers ask
What the key records
The key lists original domain exclusions, the reduced expression, holes, intercepts and end behavior before showing the graph. Curves are split at poles, holes stay open and asymptotes are dashed.
Learning objective
What this activity builds
Connect transformations of a reciprocal function with its domain, asymptotes, intercepts and branch shape.
Worked example
How does f(x) = 2/(x - 1) + 3 move the graph of 2/x?
One unit right and three units up, with asymptotes x = 1 and y = 3.
The denominator is zero at x = 1, which gives the vertical asymptote. Far from that value, 2/(x - 1) approaches zero, so the graph approaches y = 3.
Teaching notes
Make the practice count
Draw both asymptotes lightly before plotting points.
Choose x-values on both sides of the vertical asymptote.
Use the signs of the numerator and denominator to predict which regions contain each branch.
Keep the same seed when comparing a student sheet with its key.
Make it yours
Customize the practice
Choose your options, update the preview, then download the exact same pages.
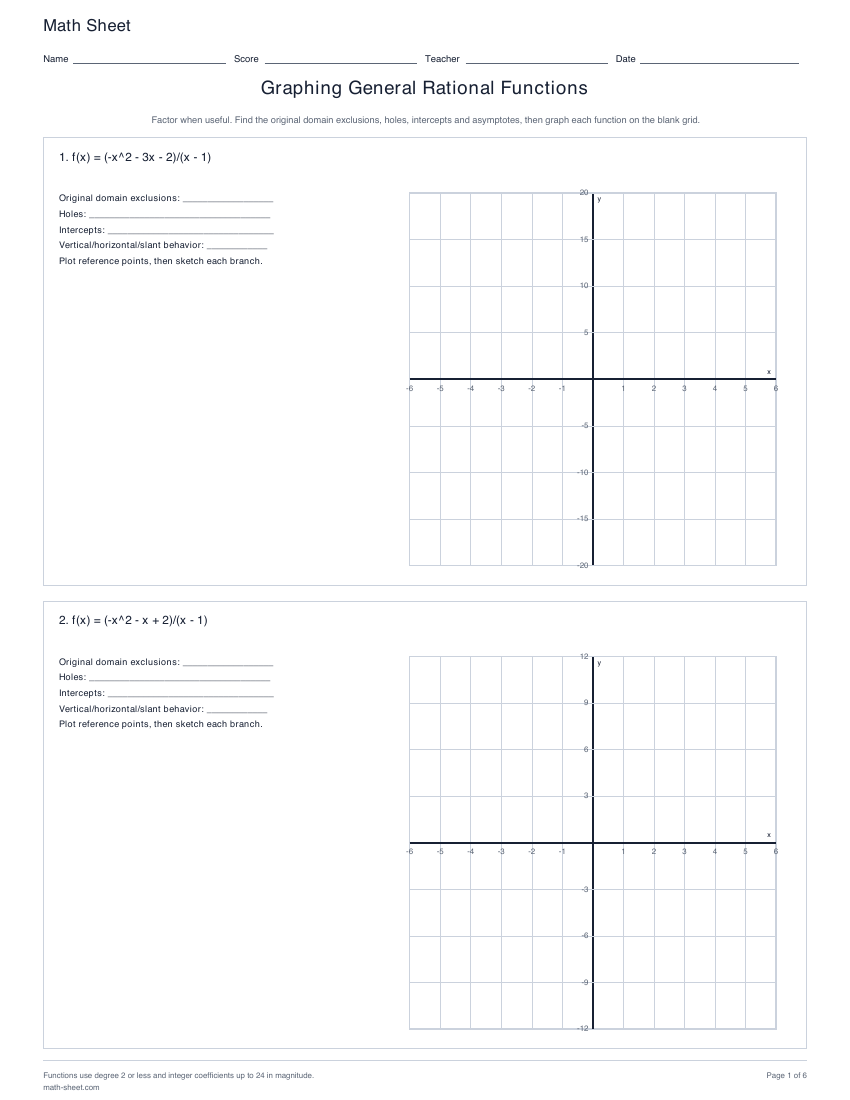
Choose 4, 8 or 12 graphs. Student pages provide labeled blank grids; the separate key shows exact features and broken curve branches.
Analyze and graph rational functions whose numerator and denominator each have degree at most 2, including poles, removable holes and horizontal, slant or polynomial end behavior.
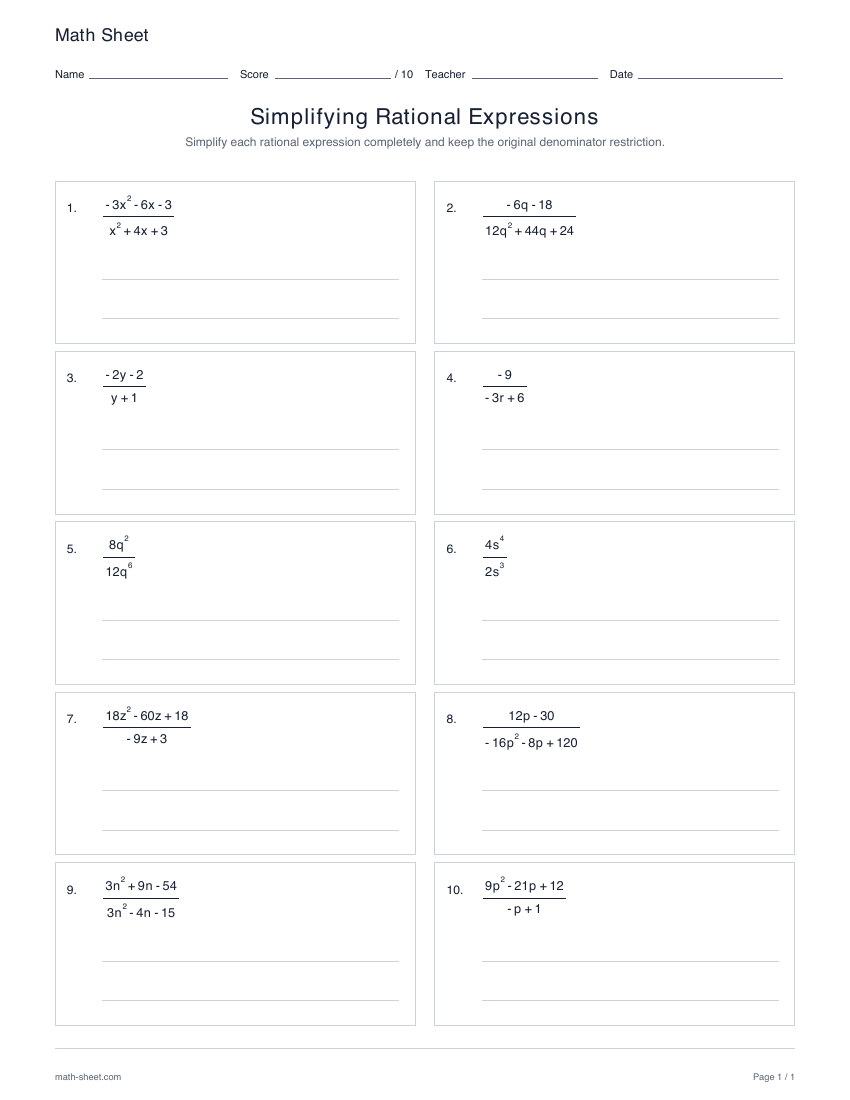
Practice ten exact single-quotient reductions with monomial, binomial or trinomial inputs, complete cancellation and retained original denominator restrictions.
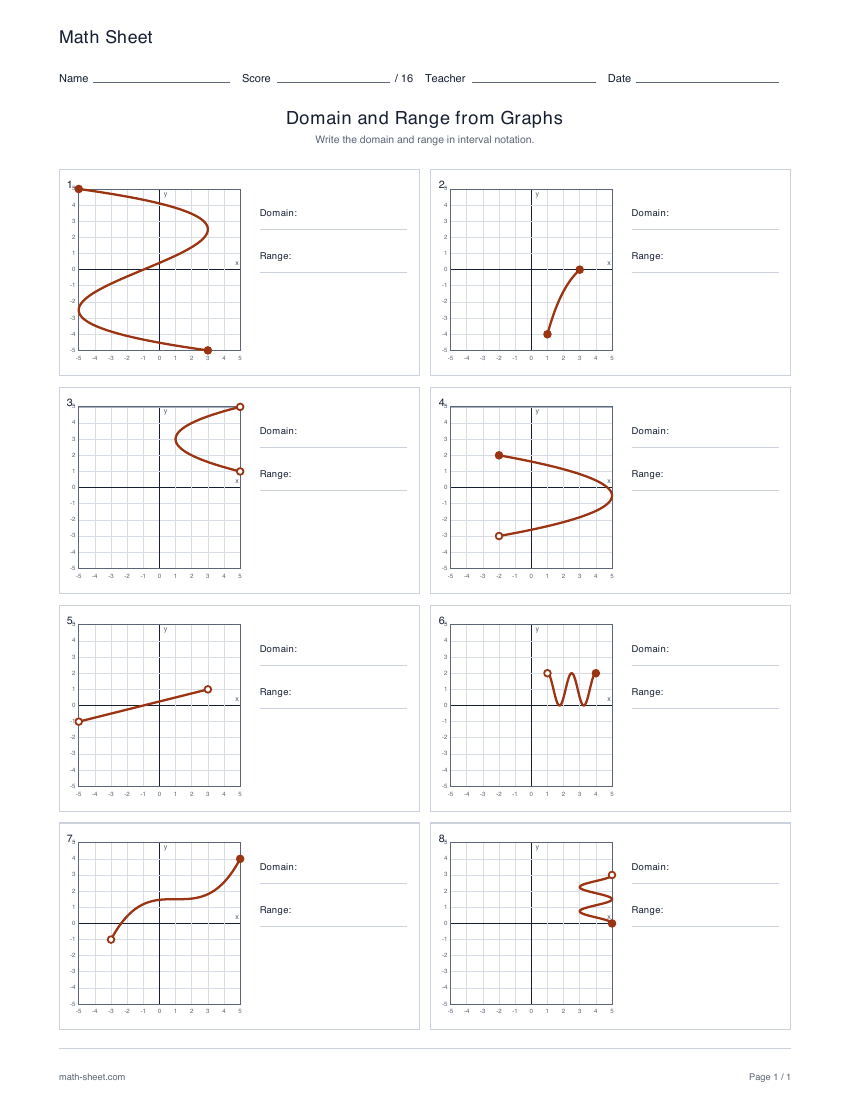
Read finite domain and range intervals from eight varied relation graphs. Practice open and closed extrema and optionally apply the vertical line test.