Precalculus practice

Sinusoidal Modeling

Build exact sine or cosine models from noiseless extrema, tables, or graphs in circular, tide, seasonal, and harmonic contexts.

Ready-made English PDF · fixed settings

Customization below makes a separate PDF.

Fixed English ready-made files. Custom settings below apply only to the configured PDF.

Ready to print

Start with a ready-made worksheet

State the modeling assumptions, identify amplitude, midline, period and phase, then answer the contextual query with units.

Download the practice pages alone, or include a separate answer key or teacher model. Longer activities may use more than one page.

Customize this worksheet

Paper sizes and printing help · More precalculus activities

Keep exact structure and restrictions visible

These worksheets pair exact algebra with labeled graph scales, explicit domains, bounded intervals, and model assumptions. The generated teacher key uses the same resolved task document as the student preview.

Learning objective

What this activity builds

Derive amplitude, midline, period, frequency, and phase, then interpret a bounded contextual query.

Worked example

A tide ranges from 2 m to 8 m every 12 hours.

Amplitude 3 m, midline 5 m, period 12 h.

Amplitude is half the range and midline is the average of the extrema.

Teaching notes

Make the practice count

  • Mark a reference maximum or midline crossing before choosing sine or cosine.
  • Keep angular frequency separate from period.
  • State that the supplied data are exact and periodic.

Make it yours

Customize the practice

Choose your options, update the preview, then download the exact same pages.

Choose the task families and representations to practice. All controls are bounded; keep the seed to reproduce the same numerical givens.

Worksheet settings

Contexts
Given information
Queries
Page note and reproducible seed

The same settings and seed make the same questions. Shared links include your page note; leave personal information out.

Configured PDF · Sinusoidal Modeling · US Letter

Preview ready. Download includes these exact pages.

3 student pages
Enlarged pages scroll. PDF size stays the same.
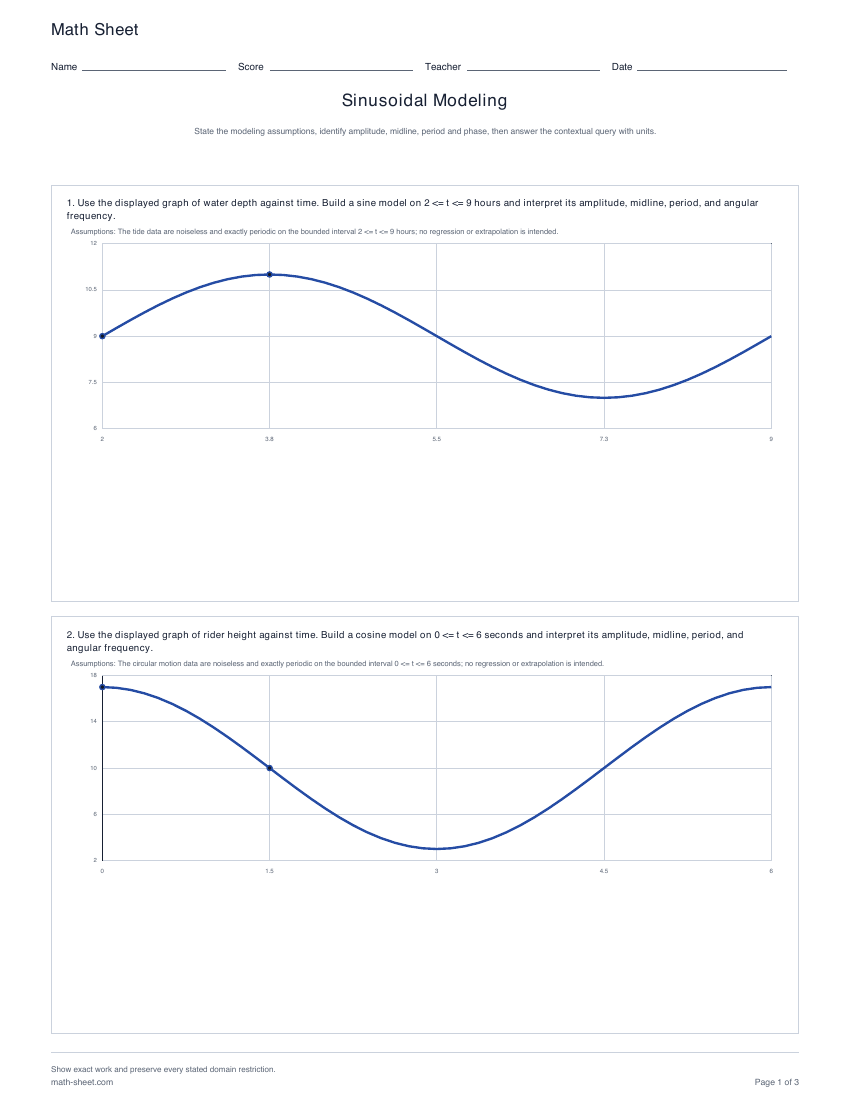
Math SheetNameScoreTeacherDateSinusoidal ModelingState the modeling assumptions, identify amplitude, midline, period and phase, then answer the contextual query with units.1. Use the displayed graph of water depth against time. Build a sine model on 2 <= t <= 9 hours and interpret its amplitude, midline, period, and angularfrequency.Assumptions: The tide data are noiseless and exactly periodic on the bounded interval 2 <= t <= 9 hours; no regression or extrapolation is intended.263.87.55.597.310.59122. Use the displayed graph of rider height against time. Build a cosine model on 0 <= t <= 6 seconds and interpret its amplitude, midline, period, andangular frequency.Assumptions: The circular motion data are noiseless and exactly periodic on the bounded interval 0 <= t <= 6 seconds; no regression or extrapolation is intended.021.563104.514618Show exact work and preserve every stated domain restriction.math-sheet.comPage 1 of 3
Math SheetNameScoreTeacherDateSinusoidal ModelingState the modeling assumptions, identify amplitude, midline, period and phase, then answer the contextual query with units.3. Use the displayed graph of rider height against time. Build a sine model on 2 <= t <= 12 seconds and find the rider height at t=4.5 seconds.Assumptions: The circular motion data are noiseless and exactly periodic on the bounded interval 2 <= t <= 12 seconds; no regression or extrapolation is intended.274.5117159.51912234. The rider height ranges from 5 to 17 meters, repeats every 6 seconds, and at t=1 crosses the midline while increasing. Build a sine model on 1 <= t <= 7seconds and find the first maximum with t>1.Assumptions: The circular motion data are noiseless and exactly periodic on the bounded interval 1 <= t <= 7 seconds; no regression or extrapolation is intended.Show exact work and preserve every stated domain restriction.math-sheet.comPage 2 of 3
Math SheetNameScoreTeacherDateSinusoidal ModelingState the modeling assumptions, identify amplitude, midline, period and phase, then answer the contextual query with units.5. The average temperature ranges from 3 to 11 degrees Celsius, repeats every 5 months, and at t=0 is at a maximum. Build a cosine model on 0 <= t <= 5months and find the average temperature at t=1.25 months.Assumptions: The seasonal data are noiseless and exactly periodic on the bounded interval 0 <= t <= 5 months; no regression or extrapolation is intended.6. Use the displayed graph of average temperature against time. Build a cosine model on 2 <= t <= 7 months and interpret its amplitude, midline, period,and angular frequency.Assumptions: The seasonal data are noiseless and exactly periodic on the bounded interval 2 <= t <= 7 months; no regression or extrapolation is intended.273.39.54.5125.814.5717Show exact work and preserve every stated domain restriction.math-sheet.comPage 3 of 3

A useful next step

Related activities

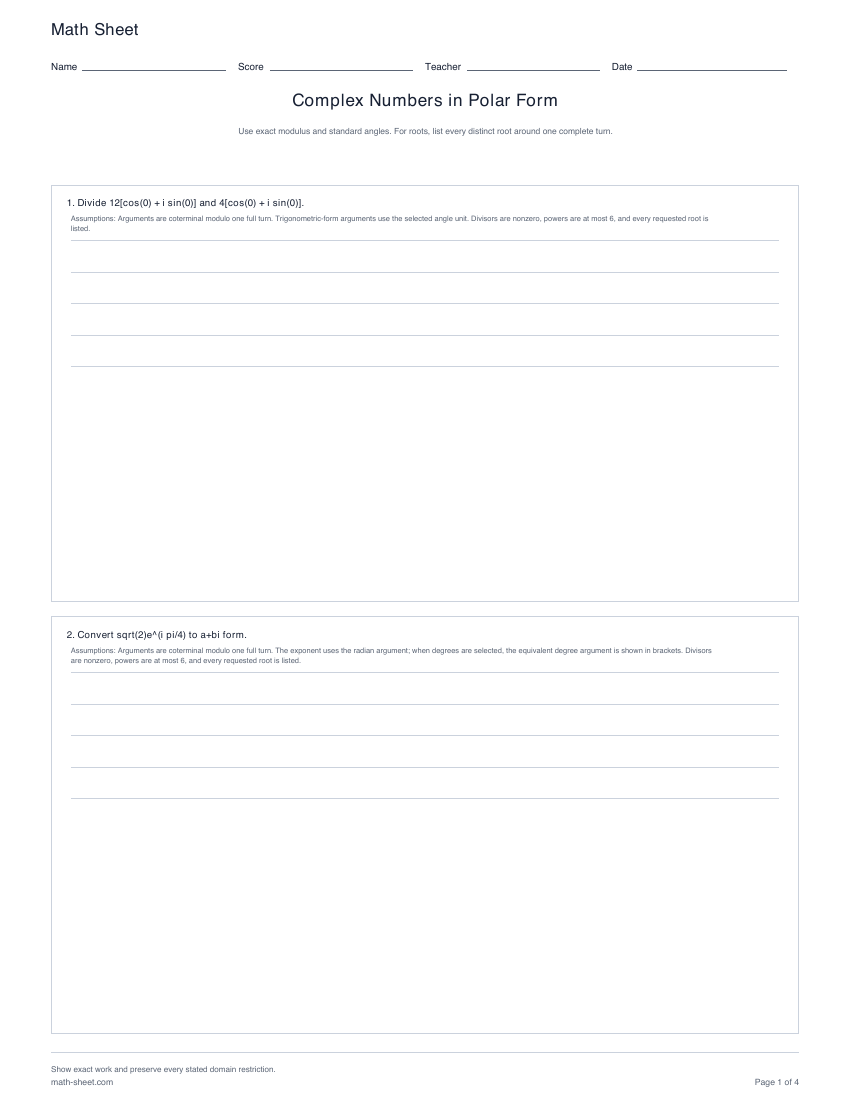
Printable complex numbers in polar form preview

Precalculus

Complex Numbers in Polar Form

Convert polar and rectangular forms, multiply and divide, apply De Moivre's theorem, and list all roots through fourth degree.

Preview and download