
Graph
Draw single line graphs
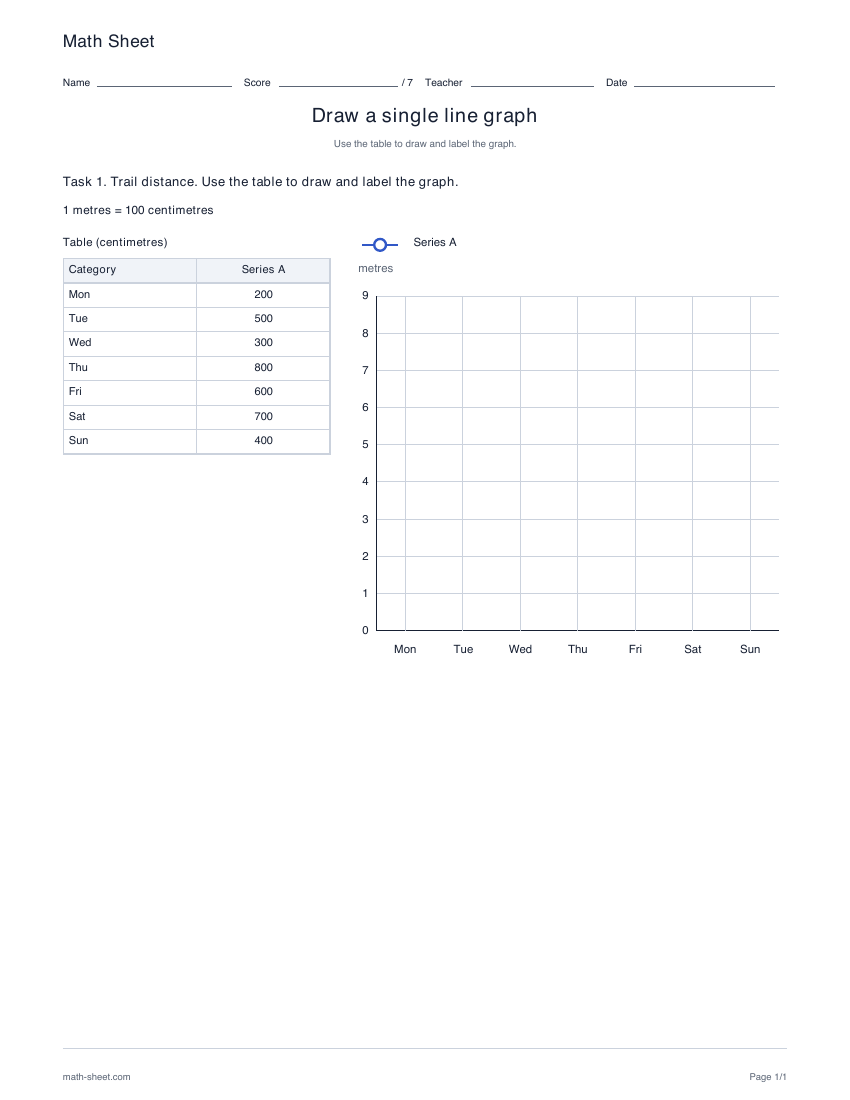
Turn a data table into a line graph. Easy practice has five categories; hard practice has seven and an explicit conversion between table and axis units.
Preview and downloadGraph practice
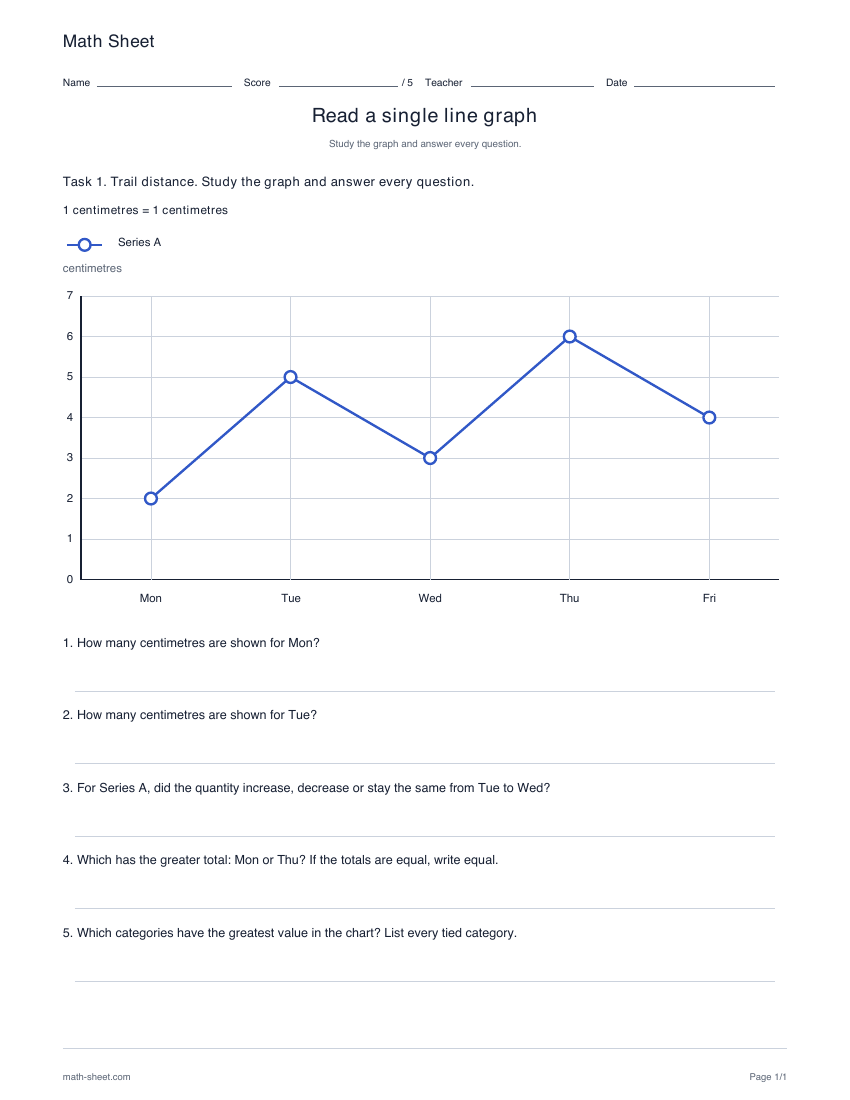
Answer five questions from a completed line graph, from reading values and changes to combining quantities and explaining comparisons.
Ready-made English PDF · fixed settings
Customization below makes a separate PDF.
Fixed English ready-made files. Custom settings below apply only to the configured PDF.
Ready to print
Check the scale and units before answering. Trace from the named category to its point, then use the question to decide whether to read, compare or calculate.
Download the practice pages alone, or include a separate answer key or teacher model. Longer activities may use more than one page.
Customize this worksheetRead the axis or symbol key before answering. Hard drawing tasks state a conversion between table and axis units. A stack of X marks or pictures is a quantity only after applying its printed key.
The static image shows the first student page. Each download includes every student page; the answer version adds the complete separate key. Some activities use multiple pages to keep charts, labels and response spaces readable.
Learning objective
Read plotted values accurately and select the operation needed by a graph question.
Worked example
The quantity increased by 6.
The later point is higher. Subtract the earlier value from the later value to measure the increase.
Teaching notes
Make it yours
Choose your options, update the preview, then download the exact same pages.
A useful next step
Graph
Turn a data table into a line graph. Easy practice has five categories; hard practice has seven and an explicit conversion between table and axis units.
Preview and download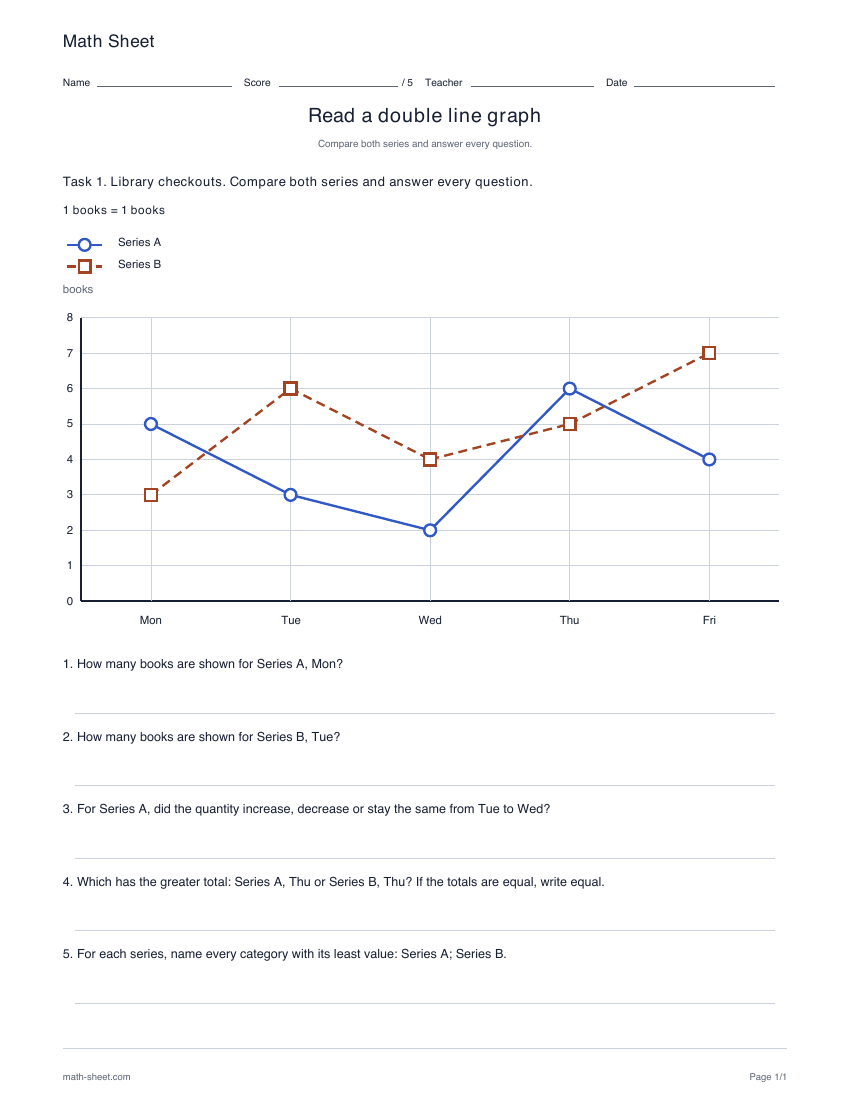
Graph
Compare two series on a shared graph and answer five questions about values, changes, totals and differences.
Preview and download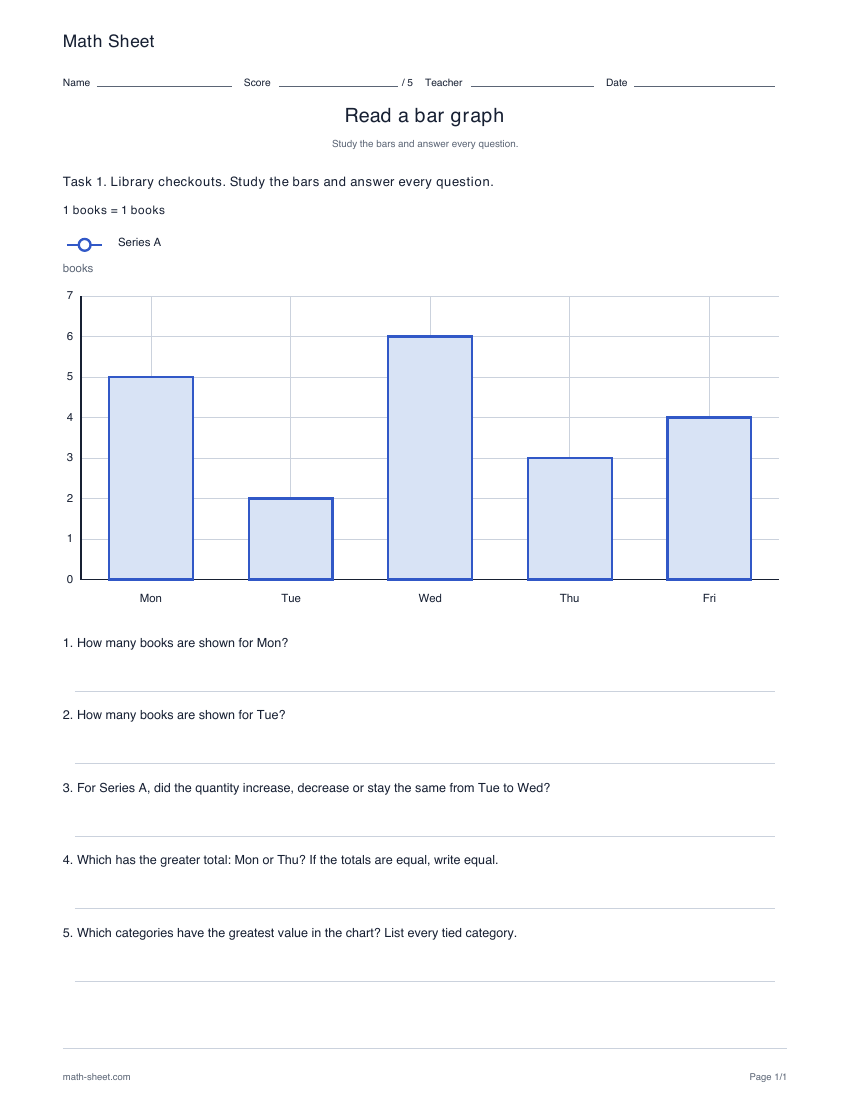
Graph
Use a completed bar chart to read values, find changes and comparisons, or calculate sums and differences in five focused questions.
Preview and download