
Geometry
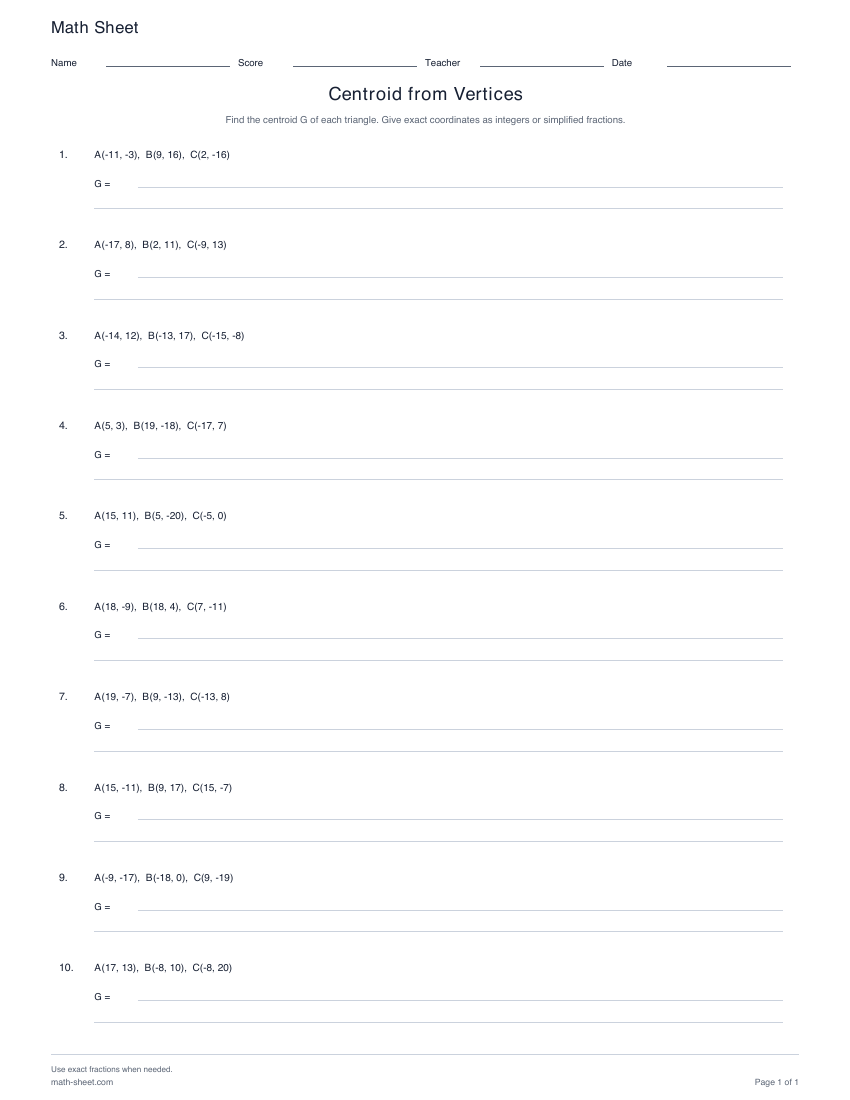
Centroid from Vertices Worksheets
Find triangle centroids from three given vertices, with exact integer or fraction coordinates.
Preview and downloadGeometry practice
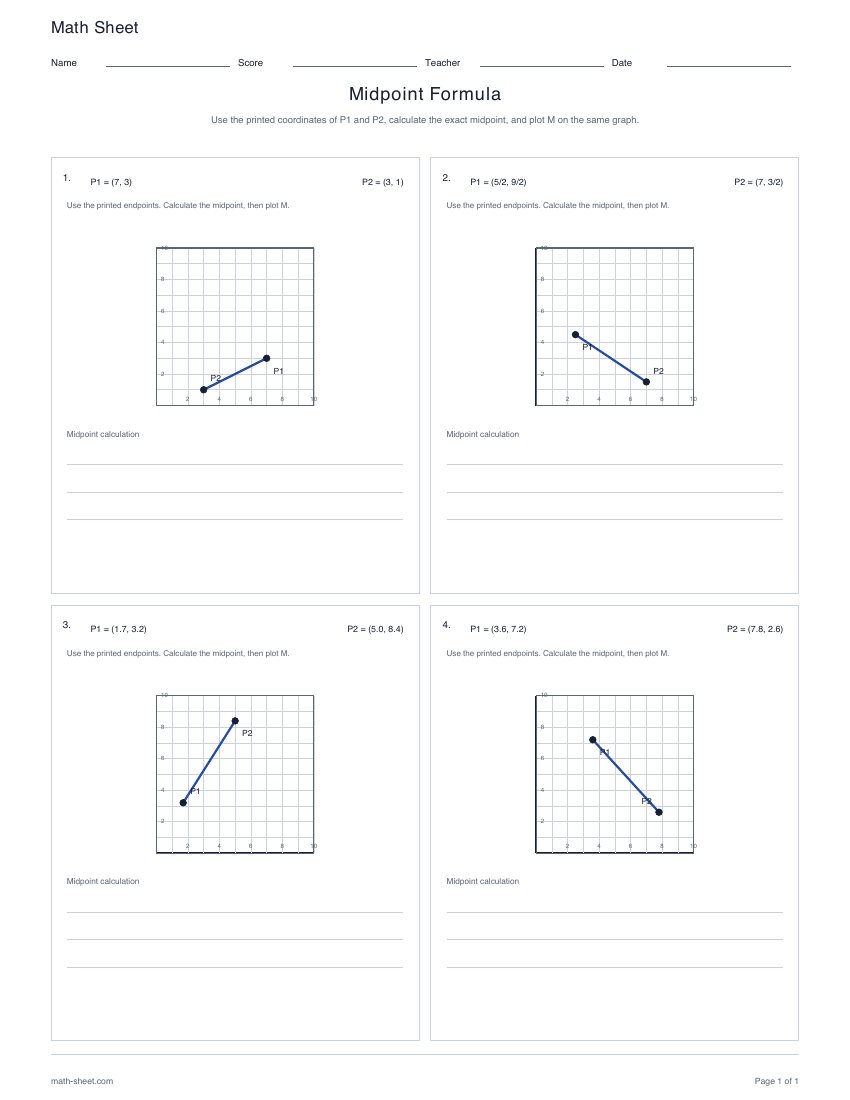
Calculate exact midpoints from printed whole-number, decimal-tenths, fractional or mixed endpoints, then plot each midpoint in the first quadrant or all four quadrants.
Ready-made English PDF · fixed settings
Customization below makes a separate PDF.
Fixed English ready-made files. Custom settings below apply only to the configured PDF.
Ready to print
Use the printed P1 and P2 coordinates, calculate their exact midpoint and plot M on the same graph.
Download the practice pages alone, or include a separate answer key or teacher model. Longer activities may use more than one page.
Customize this worksheetUse the printed P1 and P2 values, average the x-coordinates and y-coordinates separately, then plot M on the supporting graph.
Learning objective
Average two printed endpoint coordinates exactly and plot the midpoint.
Worked example
M = (3, 5.5).
Average each coordinate separately: (1.2 + 4.8)/2 = 3 and (3.4 + 7.6)/2 = 5.5.
Teaching notes
Make it yours
Choose your options, update the preview, then download the exact same pages.
Four plotted segments print both endpoints so students can calculate an exact midpoint and plot M. Choose whole numbers, decimals, fractions, or a mixed set in first-quadrant or all-quadrant grids.
A useful next step
Geometry
Find triangle centroids from three given vertices, with exact integer or fraction coordinates.
Preview and download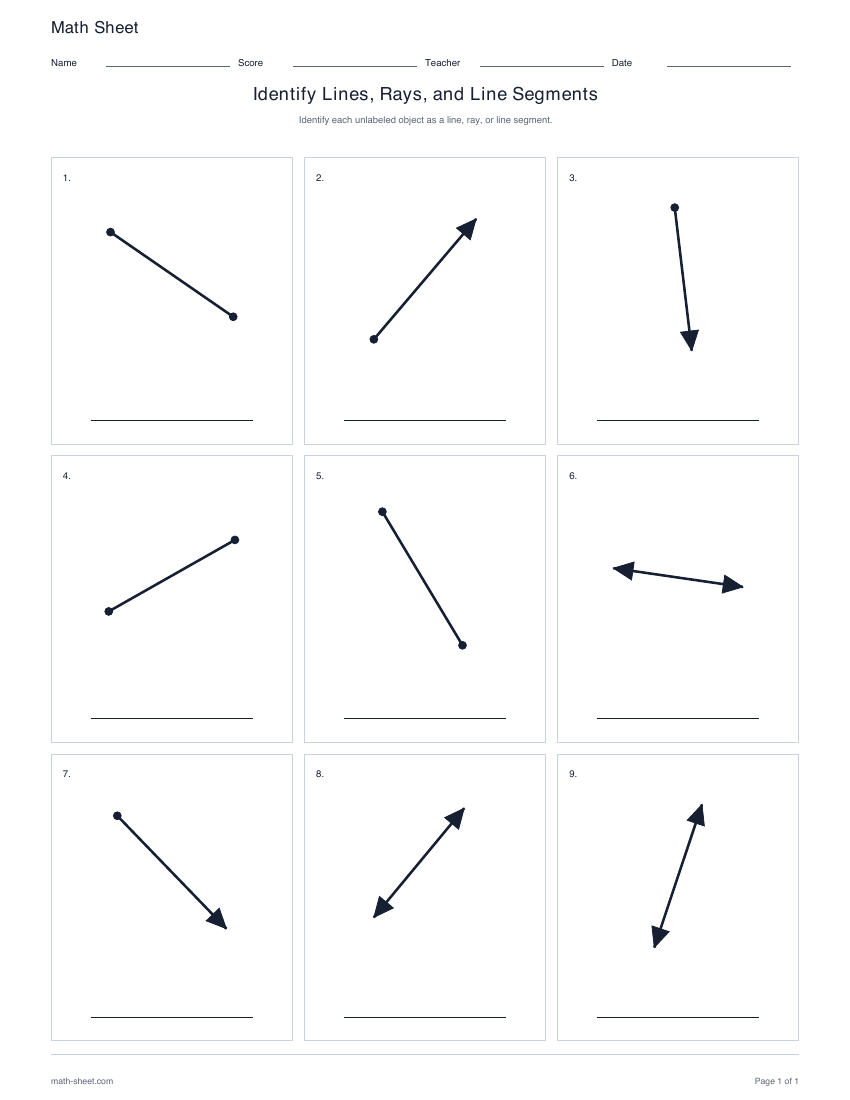
Geometry
Identify nine diagrams by their endpoints and arrowheads, with varied orientations and a separate answer key.
Preview and download