Calculus practice

Approximating Area under a Curve worksheets

Draw and calculate left-endpoint, right-endpoint and midpoint rectangle estimates for explicit polynomial, trigonometric, exponential and natural-log functions.

Ready-made English PDF · fixed settings

Customization below makes a separate PDF.

Fixed English ready-made files. Custom settings below apply only to the configured PDF.

Ready to print

Start with a ready-made worksheet

Draw the stated rectangles, evaluate the function at the correct sample points and multiply the height sum by the common width.

Download the practice pages alone, or include a separate answer key or teacher model. Longer activities may use more than one page.

Customize this worksheet

Paper sizes and printing help · More calculus activities

Connect the function to every rectangle

Each graph shows the actual function, interval and partitions. Students draw rectangles at the stated left endpoints, right endpoints or midpoints, then use the same sample values in the numerical estimate.

Learning objective

What this activity builds

Use a function graph and equal-width rectangles to approximate geometric area under a positive curve.

Worked example

Where is the sample point for a midpoint rectangle?

Halfway between the subinterval endpoints.

Evaluate the function at that midpoint; the rectangle runs from the subinterval's left boundary to its right boundary.

Teaching notes

Make the practice count

  • Mark every partition before drawing rectangles.
  • Match each rectangle height to its stated endpoint or midpoint.
  • Keep full calculator precision and round only the final estimate to three decimals.

Make it yours

Customize the practice

Choose your options, update the preview, then download the exact same pages.

Choose 4 or 8 tasks, one or more sampling methods, 3 through 6 rectangles, and any function groups. With 4 tasks and all 5 groups, four balanced groups appear; change the seed for another selection.

Worksheet settings

Methods
Rectangles
Functions

With 4 tasks and all 5 groups, four balanced groups appear; change the seed for another selection.

Page note and reproducible seed

The same settings and seed make the same questions. Shared links include your page note; leave personal information out.

Configured PDF · Approximating Area under a Curve · US Letter

Preview ready. Download includes these exact pages.

2 student pages
Enlarged pages scroll. PDF size stays the same.
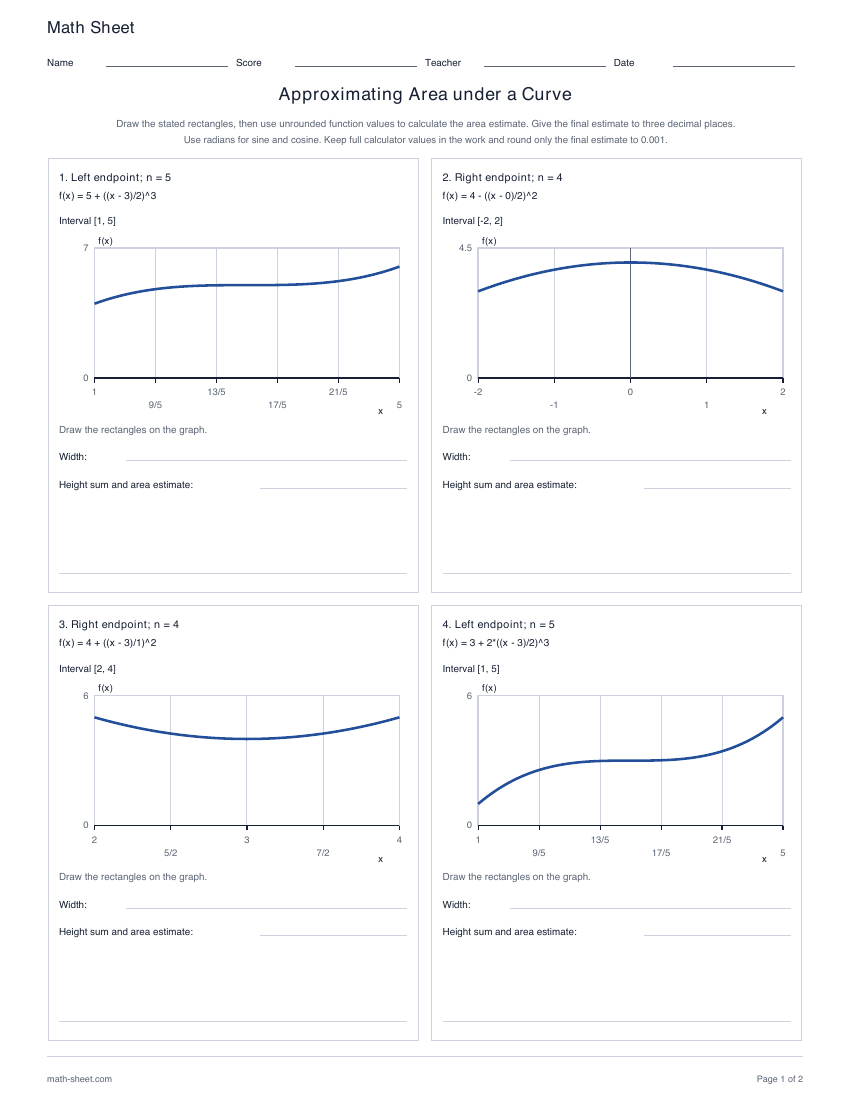
Math SheetNameScoreTeacherDateApproximating Area under a CurveDraw the stated rectangles, then use unrounded function values to calculate the area estimate. Give the final estimate to three decimal places.Use radians for sine and cosine. Keep full calculator values in the work and round only the final estimate to 0.001.1. Left endpoint; n = 5f(x) = 5 + ((x - 3)/2)^3Interval [1, 5]19/513/517/521/5507xf(x)Draw the rectangles on the graph.Width:Height sum and area estimate:2. Right endpoint; n = 4f(x) = 4 - ((x - 0)/2)^2Interval [-2, 2]-2-101204.5xf(x)Draw the rectangles on the graph.Width:Height sum and area estimate:3. Right endpoint; n = 4f(x) = 4 + ((x - 3)/1)^2Interval [2, 4]25/237/2406xf(x)Draw the rectangles on the graph.Width:Height sum and area estimate:4. Left endpoint; n = 5f(x) = 3 + 2*((x - 3)/2)^3Interval [1, 5]19/513/517/521/5506xf(x)Draw the rectangles on the graph.Width:Height sum and area estimate:math-sheet.comPage 1 of 2
Math SheetNameScoreTeacherDateApproximating Area under a CurveDraw the stated rectangles, then use unrounded function values to calculate the area estimate. Give the final estimate to three decimal places.Use radians for sine and cosine. Keep full calculator values in the work and round only the final estimate to 0.001.5. Right endpoint; n = 4f(x) = 4 + ((x + 1)/2)^2Interval [-3, 1]-3-2-10106xf(x)Draw the rectangles on the graph.Width:Height sum and area estimate:6. Left endpoint; n = 5f(x) = 3 - 2*((x + 1)/1)^3Interval [-2, 0]-2-8/5-6/5-4/5-2/5006xf(x)Draw the rectangles on the graph.Width:Height sum and area estimate:7. Left endpoint; n = 4f(x) = 5 - 2*((x - 1)/2)^2Interval [-1, 3]-1012306xf(x)Draw the rectangles on the graph.Width:Height sum and area estimate:8. Right endpoint; n = 5f(x) = 5 - ((x + 3)/2)^3Interval [-5, -1]-5-21/5-17/5-13/5-9/5-107xf(x)Draw the rectangles on the graph.Width:Height sum and area estimate:math-sheet.comPage 2 of 2

A useful next step

Related activities

First page preview: Riemann Sum Tables worksheets

Calculus

Riemann Sum Tables worksheets

Calculate exact left-endpoint, right-endpoint and midpoint Riemann-sum area estimates from complete tables on uniform intervals.

Preview and download
First page preview: Power Rule Integration worksheets

Calculus

Power Rule Integration worksheets

Find exact indefinite integrals of polynomial, reciprocal integer-power, and reciprocal rational-power functions while preserving the original real domain.

Preview and download